TL;DR: Finding the most profitable unit in a condo development
- Collect every unit’s price and size across the entire development, then calculate the psf for each
- Plot this psf data as a bell curve (normal distribution) to see how pricing actually spreads across the project
- The sweet spot for profitability consistently falls between the 25th and 55th percentile of that curve
- Buying below the 25th percentile often means compromising on floor, facing, or stack quality
- Buying above the 55th percentile means you’re paying a premium that’s harder to recoup on resale
- Own-stay buyers should lean toward the higher end of that range (closer to the 55th percentile) for a better unit
- Pure investors should lean toward the lower end (closer to the 25th percentile) to maximise margin
- This method has helped clients achieve 20% to 40% stronger returns than neighbouring units in the same project
Here’s something most buyers never think to check. Within the exact same condo development, some units genuinely make more money than others, sometimes 20% to 40% more than a unit just a few floors away or one stack over. Same building, same facilities, same launch date, wildly different outcomes. So how do you actually find the most profitable unit in the entire condo development before you buy, instead of finding out the hard way years later?
At SG Luxury Condo, we’ve used a specific mathematical model, the bell curve, to help clients consistently identify these units, and it’s genuinely simpler to apply than it sounds. Here’s exactly how it works, and how you can use it yourself
What “Most Profitable Unit” Actually Means in a Single Development
Every condo development isn’t priced uniformly. A ground floor unit facing a car park sells for a genuinely different psf than a high floor unit with an unobstructed view, even though they might be in the exact same block, same layout, same year of completion. Most buyers instinctively understand this, but very few actually quantify it before choosing which specific unit to buy.
That’s the gap this method closes. Rather than guessing based on gut feeling, “high floor feels safer” or “corner unit feels nicer”, the bell curve method uses the development’s own actual pricing data to show you, mathematically, where the best value genuinely sits.
Step 1: Collect the Development’s Full Pricing Data
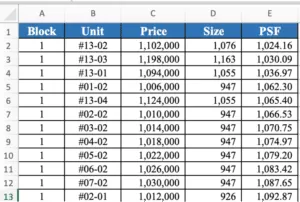
Before you can build a bell curve, and before you can genuinely find the most profitable unit in the entire condo development you’re considering, you need the raw numbers. For every unit in the development, whether it’s a new launch or a completed resale project, gather:
- The unit’s price (asking price for new launch, transacted price for resale comparisons)
- The unit’s size in square feet
- From these two, calculate the psf (price per square foot) for every single unit
Bell Curve Data Set for Condo in Terms of Price, Size, and PSF
For new launches, this data is usually available through the developer’s official price list. For completed developments, URA’s transaction data gives you actual caveats lodged for that specific project, which is more reliable than asking prices since it reflects what buyers genuinely paid.
Step 2: Build the Bell Curve
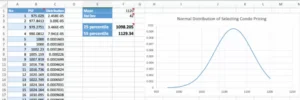
Once you’ve got psf figures for every unit, plot them as a normal distribution, a bell curve. Most units will cluster around a central average psf, with fewer units priced significantly above or below that midpoint, the classic bell shape.
Finalised Bell Curve Showing PSF Distribution Across a Condo Development
Step 3: Identify the 25th to 55th Percentile Range
This is the core of the method, and it’s the part most buyers never think to calculate. Based on repeated analysis across multiple developments, the most consistently profitable units sit between the 25th and 55th percentile of the psf bell curve, not the cheapest units, and not the priciest ones either.
Percentile Range | What’s There | Should You Buy Here? |
Below 25th percentile | Cheapest units, usually low floor, poor facing, or facing a wall/carpark | Often too compromised on quality to attract strong resale demand |
25th to 55th percentile | The sweet spot, genuinely good units at a fair, undervalued price | Yes, this is where the strongest, safest returns consistently sit |
Above 55th percentile | Premium units, high floor, best facing, corner units | Still fine for own-stay, but harder to recoup the premium on resale |
Above 90th percentile | change to exceptional, premium stacks at the highest floor. | Prestige buys, but the psf premium rarely translates proportionally into resale profit |
Step 4: Choose Where You Sit Within That Range Based on Your Goal
Not every buyer should aim for the exact same spot within the 25th to 55th percentile band. Your own objective should shape where within that range you land.
- If you’re buying for investment, lean toward the lower end of the range, closer to the 25th percentile. This maximises your margin, since you’re buying as close as possible to the floor of the “safe zone” without dropping into the compromised units below it.
- If you’re buying for your own stay, lean toward the upper end, closer to the 55th percentile, or slightly beyond it if a specific feature genuinely matters to your family. You’ll pay a bit more, but you’re also getting a noticeably better unit to actually live in.
The one number worth avoiding either direction is straying meaningfully outside this range altogether. Units below the 25th percentile often carry a real reason for their discount, poor layout, bad facing, unfortunate stack, that a low price alone doesn’t fix. Units above the 55th percentile can still be excellent homes, but the extra premium becomes progressively harder to recover when you eventually sell.
Why This Method Actually Works
The logic behind this isn’t arbitrary. Units priced below the 25th percentile are usually cheap for a specific, structural reason, often something a buyer can’t easily change, like a low floor facing a busy road or a wall. Units above the 55th percentile are commanding a premium buyers are willing to pay upfront, but that same premium then becomes the ceiling you need a future buyer to also pay, a harder ask, especially in a softer market.
The 25th to 55th percentile band is where you get genuinely solid units, not the most compromised stock in the development, without paying for the very top-tier premium that’s hardest to recoup. It’s essentially finding where quality and price actually align, rather than chasing either extreme.
How This Connects to Floor and Stack Selection
This bell curve method pairs naturally with floor-level analysis too. Across hundreds of transactions, units in the roughly 5th to 15th floor range of a typical mid-rise development have historically delivered some of the strongest profit margins, broadly consistent with where they tend to fall within a development’s own psf bell curve. Our guide on strong property investment fundamentals covers this floor-and-stack pattern in more depth if you want the fuller picture.
A Worked Example
Here’s how you’d actually apply this to find the most profitable unit in the entire condo development you’re shortlisting. Say a development’s psf bell curve shows a 25th percentile of $1,098 psf and a 55th percentile of $1,129 psf. If you’re buying purely for investment, you’d target units priced close to $1,098 psf, right at the floor of the safe zone. If you’re buying for your own family to live in, you’d look closer to $1,129 psf or just under it, accepting a slightly higher entry price in exchange for a better unit. Either way, you’d avoid anything priced meaningfully above $1,129 psf, since that premium becomes harder to justify to a future buyer.
A Word From SG Luxury Condo
This bell curve approach has helped clients at SG Luxury Condo consistently outperform neighbouring units in the same development, sometimes by 20% to 40%, simply by replacing gut instinct with actual pricing data. You can check our track record to see how this kind of disciplined unit selection has played out for real clients over time.
If you’re shortlisting a specific development and want help applying this method to the actual units available, SG Luxury Condo is happy to run the numbers with you. Our property consultation sessions cover exactly this kind of detailed unit selection, and you’re welcome to browse our full range of luxury condos for sale in Singapore once you’re ready to apply this approach to a real shortlist.