Property Affordability in Singapore
Categoriesarticles

Property Affordability in Singapore: What You Can Really Afford in 2026

Someone messaged me last week asking, almost apologetically, “Is it stupid to think I can afford a condo?” It wasn’t stupid at all. She just didn’t have the numbers in front of her. And that’s the real issue with property affordability in Singapore. It’s not that people can’t afford homes, it’s that most people are guessing instead of calculating.

So let’s calculate.

TL;DR

  • Your borrowing power is capped by TDSR (55% for private property) or MSR (30% for HDB and new ECs), not by how much you’d like to spend.
  • Banks will only lend up to 75% of a property’s value (LTV), so you need cash and CPF for the rest.
  • A household earning $14,000 to $17,500 a month can typically afford up to $2.8 million, more than most people assume.
  • Downpayment isn’t your only upfront cost. BSD, ABSD, legal fees, and renovation all add up.
  • CPF, interest rates, and whether you buy new launch or resale all shift your real affordability, sometimes by a lot.
  • Run your own numbers before deciding anything. A calculator takes two minutes; a bad decision takes 25 years to fix.

What “Property Affordability” Actually Means in Singapore

Affordability here isn’t a feeling. It’s math set by the Monetary Authority of Singapore, and the math doesn’t care how badly you want the corner unit with the pool view.

Three rules decide what you’re allowed to borrow:

  • TDSR (Total Debt Servicing Ratio): All your monthly debts, including the new home loan, car payments, and credit card minimums, can’t exceed 55% of your gross income. Applies to private property and resale ECs past their MOP.
  • MSR (Mortgage Servicing Ratio): For HDB flats and new ECs, the mortgage alone can’t go past 30% of income. Stricter than TDSR, because public housing is meant to stay within reach for more people.
  • LTV (Loan-to-Value): Banks currently cap loans at 75% of the property’s value. The remaining 25% comes from your cash and CPF.

Once you know where you land on these three, the rest is just arithmetic.

How Much Income Do You Actually Need?

I get asked this constantly, so here’s a rough breakdown based on recent resale prices, a 25-year loan, and 75% LTV. No CPF housing grants factored in, since those vary by household.

Property Affordability Type

Typical Resale Price

Minimum Downpayment

Monthly Repayment

Income Needed (Monthly)

HDB 3-Room

~$445,000

~$111,000

~$1,600

~$5,900

HDB 4-Room

~$630,000

~$157,000

~$1,900

~$8,300

HDB 5-Room

~$736,000

~$184,000

~$2,200

~$9,700

Executive Condominium (EC)

~$1,518,000

~$380,000

~$4,600

~$9,900

Condo (OCR)

~$1,650,000

~$412,000

~$5,000

~$10,700

Condo (RCR)

~$2,012,000

~$503,000

~$6,100

~$13,100

Condo (CCR)

~$2,370,000

~$592,000

~$7,200

~$15,400

Landed (Terrace)

~$3,300,000

~$825,000

~$10,000

~$21,500

Worth saying plainly: this table excludes BSD, legal fees, and renovation. It’s a starting point, not the full bill. If you want your actual numbers instead of a rough estimate, our mortgage affordability calculator will spit out a real figure in a couple of minutes based on your own income and debts.

Singaporeans Are Earning More Than the Headlines Suggest

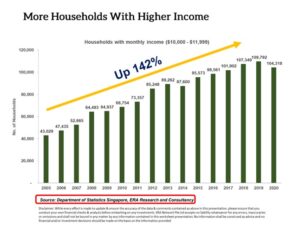
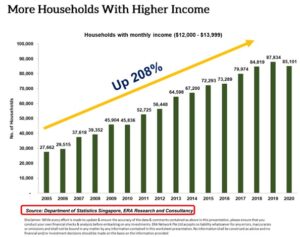
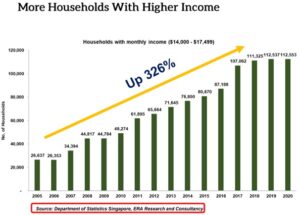
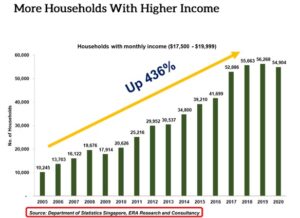
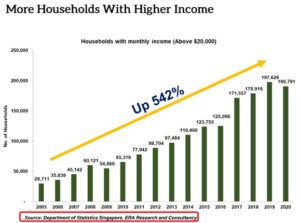
Here’s a stat that surprised me the first time I saw it. Over the past 15 years, the number of households earning between $14,000 and $17,500 a month has grown by more than 300%. That’s not a small bump, that’s a whole segment of the population moving up a bracket.

What does that actually buy you? A household in that range can typically qualify for a loan of around $2.1 million, putting a property priced up to $2.8 million within reach. Meanwhile, the average 3-bedroom private condo sits somewhere between $1.1 million and $1.7 million. There’s real breathing room there for a lot of families who assume condos are out of their league.

Monthly Household Income

Approx. Maximum Loan

Approx. Property Affordability rates

$10,000 – $12,000

$1.44 million

$1.9 million

$12,000 – $14,000

$1.68 million

$2.2 million

$14,000 – $17,500

$2.1 million

$2.8 million

$17,500 – $20,000

$2.4 million

$3.2 million

$20,000 and above

Higher, case by case

$3.5 million and up

If you’re in one of the upper brackets and still telling yourself a condo isn’t realistic, it might be worth actually running the numbers before writing it off.

Costs People Forget to Budget For

The downpayment gets all the attention. It’s not the only cost that matters.

  • Buyer’s Stamp Duty (BSD): A tiered tax on every property purchase, based on price.
  • Additional Buyer’s Stamp Duty (ABSD): This one trips up a lot of buyers, especially on a second property or as a foreign buyer. Worth checking our ABSD rates guide before you sign anything, because it can add a shocking amount to your total.
  • Legal fees: Usually a few thousand dollars, depending on the law firm.
  • Renovation and furnishing: People underestimate this constantly. Even a light refresh on a resale unit can hit five figures fast.
  • Agent fees: Typically covered by the seller in Singapore, but confirm this upfront so there’s no surprise.

None of these will sink you individually. Stack them together, though, and your cash reserves shrink faster than expected, especially if you’re also trying to keep an emergency fund intact.

How CPF Actually Changes Your Affordability

CPF is where a lot of people get their numbers wrong, in both directions. Some assume they can use CPF for everything. Others assume they can barely touch it. Neither is quite right.

Your CPF Ordinary Account can cover part of your downpayment and monthly instalments, up to certain withdrawal limits tied to the property’s valuation. For HDB purchases, CPF can go a long way. For private Property Affordability in singapore, especially higher-value condos, banks still require a minimum 5% cash component regardless of how much CPF you have sitting there. It’s a detail that catches CPF-rich, cash-poor buyers off guard more often than you’d think.

Interest Rates Move the Goalposts More Than People Realize

A one percentage point shift in your mortgage rate doesn’t sound like much until you see it on a $1.5 million loan over 25 years. That’s often a difference of several hundred dollars a month, which can be the gap between comfortably within your TDSR and uncomfortably close to the ceiling.

This is why banks stress-test loan applications at a minimum rate, regardless of what you’re actually being offered today. It protects you from a future where rates climb and your “affordable” mortgage suddenly isn’t.

New Launch vs Resale: Which Is Actually Easier on the Wallet

This gets debated a lot, and honestly, the answer depends on your cash flow more than the sticker price. New launches usually come with progressive payment schemes, so you’re not paying the full mortgage from day one, your payments scale up as construction progresses. Resale units require full payment structure from the start, but you skip the waiting period and often get more room to negotiate on price.

If you’re weighing this decision seriously, our guide on upgrading from HDB to a condo in 2026 breaks down the timing and cash flow side of things in more detail.

Foreign Buyers Face a Different Affordability Equation Entirely

If you’re not a Singapore citizen or PR, the math changes quite a bit. Foreigners face a 60% ABSD on most residential purchases, on top of the usual BSD. That alone can add hundreds of thousands of dollars to a purchase that would otherwise look affordable on paper. It doesn’t mean foreign buyers should avoid the market, but it does mean the “how much can I afford” question needs a completely different starting point.

Is Property in Singapore Actually Affordable Right Now?

Depends who you ask, honestly. Compare prices to five years ago and things feel tight. But compare income growth against loan capacity, and the picture is more balanced than the headlines make it sound. Household incomes have climbed steadily, and loan capacity for middle and upper-income families has, in several cases, kept pace with or outpaced Property Affordability prices.

But averages don’t buy houses, people do. Your affordability is personal. It depends on your income, your existing debts, your family’s needs, and how much financial risk you’re okay carrying for the next couple of decades. A household earning $12,000 a month might be perfectly set up for an OCR condo and stretched thin trying to reach for CCR. Neither is wrong. They’re just different starting points.

A Few Practical Tips If You’re Still On the Fence

  • Know your TDSR or MSR limit before you fall in love with a unit. Saves a lot of heartbreak later.
  • Don’t max out your loan just because the bank approves it. Leave room for rate hikes, job changes, or the unexpected.
  • Budget for the full cost of ownership, not just the purchase. Maintenance fees, property tax, and insurance add up over the years, especially for condos with more facilities.
  • Talk to someone who does this daily. A good Property Affordability consultant will tell you honestly if a unit is outside your comfort zone, instead of just pushing the sale through.

Final Thoughts

Property affordability in Singapore isn’t one fixed number sitting somewhere in a government report. It moves with your income, the lending rules in effect that year, and how much of your monthly paycheck you’re genuinely willing to commit for the next two and a half decades. What the data does show clearly is that a lot of Singaporean households can afford more than they think, particularly in the middle and upper income brackets. The real work isn’t affording the home. It’s figuring out where you actually stand, instead of guessing.

For a fuller walkthrough of the buying process, our guide on buying property in Singapore is a solid next stop. And if you’re already comparing units, browsing luxury condos for sale in Singapore is probably the most useful place to start looking.

At SG Luxury Condo, we work with buyers across every income bracket, not just the ones chasing penthouses. If you want a second opinion on what you can genuinely afford, reach out to our team for a free consultation. No pressure, just numbers laid out clearly.

Advanced Heading

Frequently Asked Questions

How much income do I need to buy a condo in Singapore?

Depends on the region. OCR condos typically need around $10,700 monthly household income, while CCR condos can require $15,400 or more.

TDSR caps total debt at 55% of income for private property. MSR caps mortgage payments at 30% of income, and only applies to HDB flats and new ECs.

Generally 25% of the purchase price, with at least 5% paid in cash and the rest from CPF or cash.

For HDB flats, mostly yes. For private property, banks still require a minimum 5% cash component regardless of your CPF balance.

It depends on your personal finances more than market timing. Focus on your TDSR/MSR headroom rather than trying to predict the market.

Additional Buyer’s Stamp Duty applies to second properties, foreign buyers, and certain entities, and can add a significant percentage on top of the purchase price.

Not necessarily cheaper, but new launches spread payments out over construction, which eases cash flow compared to resale’s upfront structure.

Even a 1% rate change can shift monthly repayments by hundreds of dollars, which is why banks stress-test loans at higher rates before approving them.

Roughly households earning $14,000 to $17,500 a month, assuming no other major debts and a standard 25-year loan.

Yes. Foreign buyers pay a 60% ABSD on most residential purchases, which significantly changes the total cost compared to citizens or PRs.

A Study of Mega Development in Singapore
Categoriesarticles

A Study of Mega Development in Singapore: Is It Worth Investing? (2026 Update)

Over the years, one question comes up again and again from clients at SG Luxury Condo: “Should I buy a unit in a mega development?” It’s a fair question. Big condos come with big trade-offs, more facilities, but also more neighbours, more competition when it’s time to sell, and a very different living experience than a boutique building.

So let’s actually dig into the numbers. This is an update to our earlier study of mega developments in Singapore, now with fresh data from 2025 transactions and a clearer picture of how the market has actually behaved, not just how it’s expected to behave. SG Luxury Condo tracks this segment closely, since it’s one of the most common cross-roads buyers hit when comparing two otherwise similar shortlists.

TL;DR: A mega development in Singapore is a condo with 1,000 or more units. As of early 2025, there were 24 of these across the island, holding over 30,000 units combined, and every single one is 99-year leasehold. Data from EdgeProp and Stacked shows study mega developments tend to outperform smaller condos on price growth and transaction volume, especially for smaller units bought early. But results vary a lot by project, and location still matters more than size alone. The trade-off is real too: lower maintenance fees and more facilities, against less privacy and tougher competition when you eventually sell.

What Exactly Is a Study of Mega Development?

A Stuudy mega development is simply a condo with more than 1,000 units. Some analysts stretch the definition to include projects with 900-plus units too, since the experience is largely the same. Units typically range from compact one-bedders to five-bedroom and penthouse layouts, and the sheer land area usually means an unusually large spread of facilities, multiple pools, tennis courts, function rooms, sometimes even childcare centres.

As of the most recent count, Singapore has 24 mega condo developments, with a combined total of over 30,000 units. Twenty-three are completed, with Grand Dunman still under construction. Every single one of them sits on 99-year leasehold land, and interestingly, D’Leedon is the only mega development located in a prime Central Region district. Treasure at Tampines remains the only project to cross the 2,000-unit mark, with over 2,200 units in total.

Well-known examples include Parc Clematis, Treasure at Tampines, Affinity at Serangoon, Normanton Park, The Minton, D’Leedon, Sims Urban Oasis, and Kingsford Waterbay, alongside newer large-scale launches like ParkTown Residences in Tampines North.

Why Consider a Mega Development?

1. Rental Yield Tends to Run Higher

Rental-Yield-of-Mega-Developments

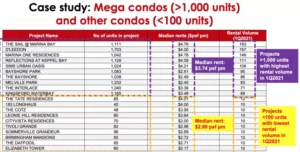
Comparing similar districts, mega developments have historically commanded a median rent of around $3.74 psf per month, against roughly $2.99 psf per month for smaller condos nearby. The extra facilities genuinely seem to justify a rental premium, tenants are willing to pay more for access to multiple pools, gyms, and recreational spaces that a boutique building simply can’t match.

2. Lower Maintenance Fees Through Economies of Scale

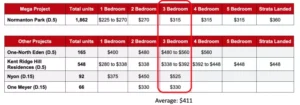
Maintenance-Fee-of-Mega-Development-vs-Smaller-Project-

With more families sharing the cost of upkeep, individual maintenance fees in mega developments tend to run noticeably lower than in smaller projects, even when the mega development actually offers far more facilities. ERA’s own comparison found similar patterns: Treasure at Tampines, for example, packs in 128 facilities, more than four times what a comparable mid-sized project in the same district offers, while still keeping fees competitive.

3. Stronger Historical Price Growth for Some Projects

This is where the data gets genuinely interesting. Treasure at Tampines has posted a 33.3% price increase since its 2019 launch, reaching around $1,785 psf, with 487 profitable resale transactions against just a single unprofitable one. Melville Park, an older mega development in the same district, has grown 30.5% since 2019 despite being nearly three decades old. Independent analysis from Stacked has found that, on average, mega developments do tend to outperform regular-sized condos, particularly for smaller units and buyers who got in during early sales phases.

That said, this isn’t universal. The Sail @ Marina Bay has recorded the highest number of unprofitable transactions among all mega developments, and Reflections at Keppel Bay, heavily marketed as a status investment, has actually lost value since launch. Location and timing still matter enormously, size alone doesn’t guarantee a good outcome.

4. A Genuinely Different Lifestyle Offering

Many mega developments include retail, dining, and childcare within the compound itself, effectively creating a self-contained neighbourhood. Families with young children, in particular, tend to get outsized value from this, since there’s rarely a reason to leave the compound for daily errands or weekend entertainment.

Mega Development vs Boutique Development: A Quick Comparison

Factor

Mega Development (1,000+ units)

Boutique Development (under 100 units)

Facilities

Extensive, often 100+

Limited to essentials

Maintenance fees

Generally lower, shared across more owners

Generally higher per unit

Privacy and community

Larger, more diverse resident base

Tighter, more intimate community

Transaction volume

High, frequent resale activity

Lower, fewer comparable transactions

Resale liquidity

Generally easier to sell, more buyer pool

Can take longer due to niche appeal

Best suited for

Families, investors, downgraders wanting activity

Singles, professionals, those valuing exclusivity

Neither option is objectively better. It genuinely comes down to what you and your future tenant or buyer will actually value.

Historical Case Study: The Minton

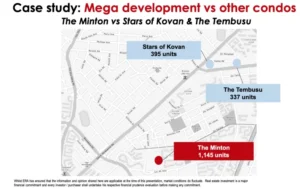
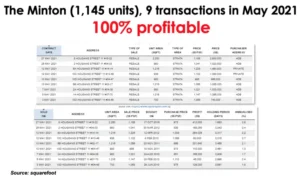
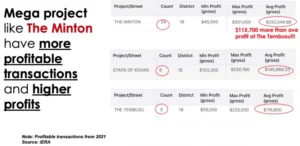
The Minton in Upper Paya Lebar remains a useful illustration of what a well-performing mega development can look like over time. In one particularly strong month of transactions, all nine recorded sales showed a 100% profit rate. Comparing average profit per transaction against two nearby, smaller developments, Stars of Kovan and The Tembusu, The Minton’s average profit came in noticeably higher, despite sitting further from the nearest MRT station.

This is a good reminder that MRT proximity, while important, isn’t the only factor driving resale performance. For more on how MRT distance actually affects pricing, our guide on the MRT effect on property prices breaks this down further.

Common Concerns About Mega Developments

“Won’t it be harder to sell with so many competing units?”

This is the most common worry, and it’s a fair one. SG Luxury Condo uses what we call the 1km Formula to check this properly: count how many comparable one-bedroom (or similar) units exist within a 1km radius of the development, then compare that figure across the mega development you’re considering and any smaller alternatives nearby. A lower count of directly competing units is generally a good sign.

A second useful check is dividing total annual transaction volume by total unit count. This tells you how actively a specific mega development is trading, and helps you spot which projects are genuinely well-received by the market versus which ones are simply large.

“Is it harder to rent out a unit in a mega development?”

Not necessarily, but it depends heavily on your target tenant pool. If the development sits near office clusters or is popular with expatriates and white-collar professionals, rental demand tends to be strong. Always research the surrounding tenant demographic before assuming either way.

“Is a mega development harder to en bloc?”

Generally, yes. Buying en bloc potential in a mega development is riskier than the same bet on a smaller, older project, since developers need significantly more capital to buy out a thousand-plus units and pay every owner their share. If en bloc upside is genuinely part of your investment thesis, our detailed guide on the pitfalls of buying for en bloc potential is worth reading first, since mega developments make this already-uncertain strategy even less likely to pay off.

Should You Buy in a Mega Development?

Based on the data, mega developments in Singapore have generally held their own, and often outperformed, comparable smaller condos, particularly for smaller unit types and buyers who entered during early sales phases. But “generally” isn’t “always.” The Sail @ Marina Bay and Reflections at Keppel Bay both show that size alone doesn’t guarantee strong returns, location, timing, and entry price still do the heavy lifting.

If you’re deciding between a mega development and a smaller boutique alternative, weighing the actual numbers matters far more than a general rule of thumb. Our breakdown of undervalued versus profitable properties covers exactly this kind of comparison in more depth.

A Word From SG Luxury Condo

We’ve walked plenty of clients through this exact decision, and the honest answer is that mega developments deserve a fair look rather than automatic dismissal or automatic preference. The data genuinely supports them as solid, often outperforming options, but the project-by-project variation means due diligence still matters as much as it would for any other purchase.

If you’ve got your eye on a specific mega development in Singapore and want a proper look at the numbers before committing, SG Luxury Condo is happy to walk through it with you. Our luxury condo real estate agents track these large-scale projects closely, and our property consultation sessions can help you compare a mega development against smaller alternatives side by side. You’re also welcome to browse our full range of luxury condos for sale in Singapore if you’re ready to start comparing options.

Advanced Heading

Frequently Asked Questions

How many mega developments are there in Singapore?

As of early 2025, there were 24 mega condo developments in Singapore, holding a combined total of over 30,000 units. Twenty-three are completed, with Grand Dunman still under construction.

Generally 1,000 units or more, though the term is sometimes stretched to include large projects with 900-plus units as well.

Often, yes, though not always. Economies of scale mean more owners are sharing the cost of upkeep, even when the development offers significantly more facilities than a smaller project nearby.

On average, data suggests mega developments tend to outperform regular-sized condos, particularly for smaller units and early buyers. But individual project performance varies significantly, so this isn’t a guarantee for every mega development.

It can be, since there are simply more comparable units on the market at any given time. Using a formula like comparing transaction volume against total unit count can help you gauge how actively a specific project is trading.

It’s currently the only mega development located in a prime Central Region district. Most mega developments sit in the Rest of Central Region or Outside Central Region, where larger land parcels are more readily available.

Yes, every one of the current 24 mega developments sits on 99-year leasehold land. There are no freehold mega developments in Singapore at this time.

Generally not a strong one. The sheer capital required to buy out a thousand-plus owners makes mega developments significantly less likely to go en bloc compared to smaller, older projects.

Reduced privacy and a less tight-knit community are the most commonly cited drawbacks, along with potential congestion at shared exits during peak hours and heavier wear on popular facilities like pools and playgrounds.

Families with young children and investors seeking rental demand and resale liquidity often do better in mega developments. Buyers prioritising privacy and exclusivity, such as singles or downgrading empty nesters, tend to prefer boutique developments instead.

Branded Residences in Singapore
Categoriesarticles

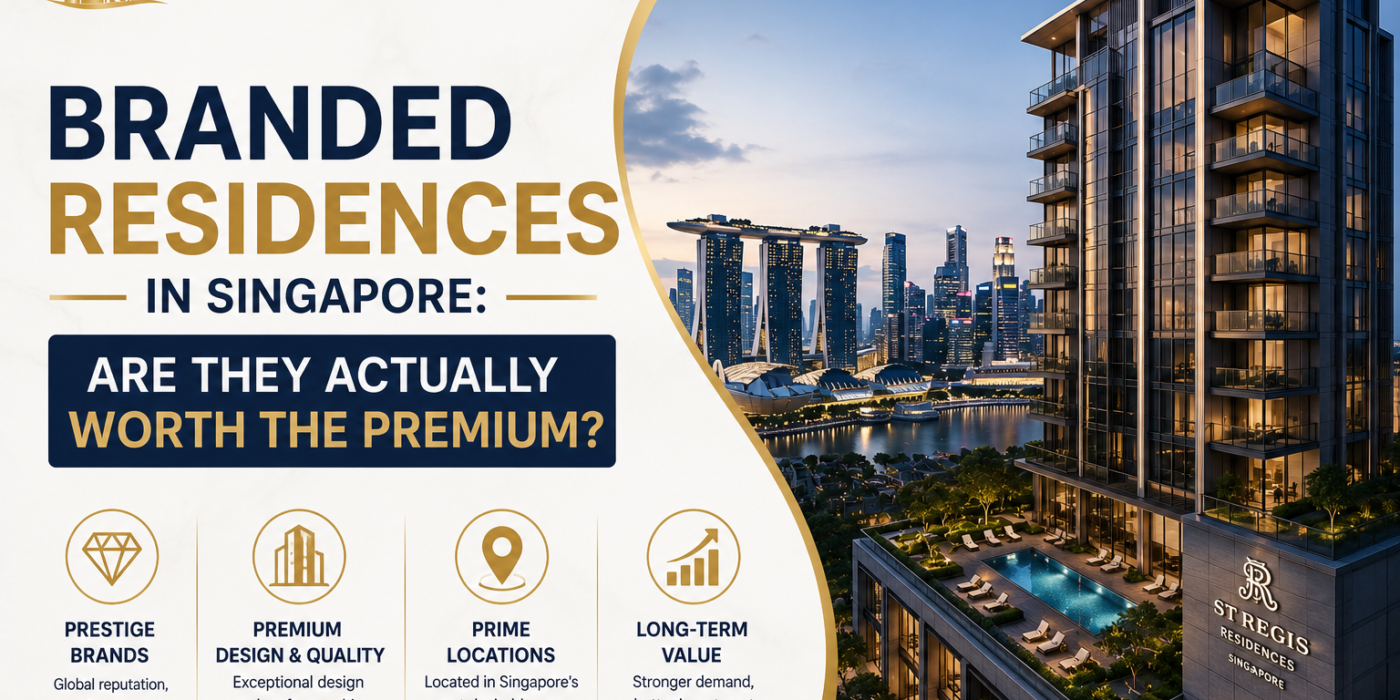
Branded Residences in Singapore: Are They Actually Worth the Premium?

St-Regis-Residences

TL;DR: Branded residences in Singapore are still a genuinely niche segment, only four developments existed before 2025: St Regis Residences, Ritz-Carlton Residences, Pullman Residences Newton, and The Residences at W Singapore Sentosa Cove. W Residences Marina View and Aman Singapore at Skywaters Residences are joining the lineup soon. 

Internationally, branded residences can command rewards of 25% to over 100% relying on the city, but Singapore data from 2022 to 2025 displays mixed results; some non-branded luxury plans nearby really matched or beat branded ones on value expansion. The brand adds real value in service, trust, and lock-and-leave convenience, but it doesn’t naturally override fundamentals like tenure, arrangement, and location.

At SG Luxury Condo, we get inquiries about branded residences in Singapore more than almost any other luxury property topic, so let’s really unpack what you’re paying for, which developments count, and whether the premium holds up once you look past the marketing brochure. We’ll walk over the actual Singapore-specific view rather than duplicating the general global talking points most articles on this issue tend to lean on.

What Are Branded Residences?

A branded residence is a personal home associated with a recognised hospitality or luxury brand, giving proprietors access to hotel-grade facilities alongside the renown of the brand name itself. Think round-the-clock concierge, in-residence dining, homemaking, and often direct access to the facilities of an connected hotel.

Internationally, more than 400 branded residence plans now survive throughout approximately 180 municipalities. Marriott alone, using brands like Ritz-Carlton, St Regis, and W, accounts for a large share of the global pipeline, alongside 4 Seasons and Accor. Over hospitality names, luxury brands like Armani, Porsche Design, and Bulgari have also entered residential real estate, lending their design language rather than lodge facilities.

branded residences

Branded Residences vs Hotel Residences: Don’t Mix These Up

These two terms get confused constantly, and the difference actually matters for how you’ll use, or invest in, the property.


Branded Residence

Hotel Residence

Ownership

Full private ownership, standard strata title

Often a sale-and-leaseback structure

Personal use

Unlimited, it’s your home

Typically limited, sometimes just a few weeks a year

Income

None, unless you choose to rent it out independently

Shared rental income with the hotel operator

Hotel services

Yes, full access

Yes, but positioned as an investment product first

Best suited for

Owner-occupiers and long-term holders wanting a serviced lifestyle

Investors specifically chasing rental yield

A hotel residence is essentially an investment vehicle. A branded residence is a home first, with hospitality-grade services layered on top.

The Actual Branded Residences in Singapore Right Now

Here’s the part most global branded residence articles skip entirely, the actual Singapore-specific landscape. And it’s smaller than you’d expect.

Development

Brand

Location

Status

St Regis Residences

St Regis (Marriott)

Tanglin

Completed, Singapore’s first branded residence, since 2008

Ritz-Carlton Residences

Ritz-Carlton (Marriott)

Cairnhill

Completed

Pullman Residences Newton

Pullman (Accor)

Newton

Completed

The Residences at W Singapore Sentosa Cove

W Hotels (Marriott)

Sentosa Cove

Completed

W Residences Marina View

W Hotels (Marriott)

Marina View

Upcoming, Singapore’s fifth branded residence

Aman Singapore at Skywaters Residences

Aman

Shenton Way (Skywaters, Singapore’s tallest tower on completion)

Upcoming

That’s it. Just four completed branded residences existed in Singapore before 2025, a remarkably small number compared to cities like Bangkok, Dubai, or even Kuala Lumpur, where the format has become far more common. Two more, W Residences Marina View and Aman Singapore, are set to join over the next few years, with Aman notably marking the ultra-luxury brand’s first-ever Singapore property, designed by longtime collaborator Kerry Hill Architects with interiors referencing Singapore’s colonial-era black and white bungalows.

Why Singapore’s Branded Residence Segment Stays So Niche

A few structural reasons explain why Singapore hasn’t seen the explosion of branded towers you’d find in Bangkok or Miami. Land here is scarce and tightly controlled through Government Land Sales, so developers have fewer opportunities to secure the large, prominent sites branded projects typically need. Singapore’s own luxury developers, CDL, UOL, Far East Organization, already carry strong reputations and pricing power on their own, reducing the need to license an external brand just to command a premium. 

And with limited pent-up supply since Pullman Residences Newton launched, there’s genuine scarcity value building for whichever branded projects do eventually launch.

SG Luxury Condo has watched this segment for years, and the pattern is consistent: Singapore buyers tend to be more discerning about what a brand actually adds, rather than paying for the name alone the way some other markets do.

Does the Brand Actually Add a Price Premium?

Urban Living

This is the honest, slightly complicated answer. Globally, branded residences have commanded eye-catching premiums, buyers have paid up to 132% more in Bangkok and 69% more in Kuala Lumpur compared to similar non-branded properties. In Sydney, early evidence from One Barangaroo suggested a more modest 25% to 35% premium over comparable non-branded product.

Singapore’s own data tells a more nuanced story. Looking at transaction data from 2022 through 2025, branded residences here have shown mixed results. Several non-branded luxury counterparts, including The Marq on Paterson Hill and Le Nouvel Ardmore, either held steady or posted similar price gains without carrying any brand premium at all. 

The takeaway is worth sitting with: branding can strengthen perceived value and support a premium, but it doesn’t override the fundamentals that actually drive resale value, tenure, site orientation, layout efficiency, and how liquid the resale market for that specific project is.

What You’re Actually Paying For

Setting the price debate aside, branded residences do offer genuinely tangible benefits that justify their appeal to a certain type of buyer, and these are worth weighing on their own merits rather than folding them entirely into the resale value conversation.

  • Trust in build quality and delivery, since the brand has its own reputation riding on the project
  • Hotel-grade services, housekeeping, concierge, in-residence dining, and often spa or wellness access
  • Consistent building management, which tends to preserve the property’s condition and value over time
  • A genuine lock-and-leave lifestyle, ideal for owners who travel frequently or split time between countries
  • Elevated status on the brand’s hotel loyalty programme, a small but real perk for frequent travellers
  • Rental pool potential in some structures, which can help offset maintenance costs if you’re not living there full-time

Is a Branded Residence Worth It for You?

Midtown-suites-Bugis

It really comes down to what you value. If a genuinely serviced, hotel-calibre lifestyle matters to you, and you’re not solely chasing the highest possible capital appreciation, a branded residence in Singapore can be a very satisfying purchase. The service quality is real, not just marketing language.

If you’re buying primarily as an investment chasing maximum returns, the Singapore data suggests you shouldn’t assume the brand name alone guarantees outperformance. A well-located, well-built non-branded luxury condo with strong fundamentals, freehold tenure, a desirable layout, an established track record, can hold its own against branded competition, sometimes outperforming it. 

For a broader look at how Singapore’s top-tier condo market stacks up beyond just the branded names, our guide on the most luxurious condominiums in Singapore is worth a read alongside this one.

A Word From SG Luxury Condo

We’ve walked clients through both sides of this decision plenty of times, and honestly, there’s no universally right answer. What matters is being clear-eyed about why you’re buying. If it’s the lifestyle and the peace of mind that comes with hotel-grade service, the premium on a branded residence in Singapore is money well spent. 

If it’s pure investment return, the fundamentals still deserve more weight than the name on the lobby wall, and that’s the balanced view SG Luxury Condo brings to every conversation on this topic.

If you’re weighing a specific branded project against a comparable non-branded alternative, SG Luxury Condo is happy to run the actual transaction data with you before you decide. Our luxury condo real estate agents track this niche segment closely, and our property consultation sessions can help you weigh a branded purchase against the broader market. If you’re curious about the scale of projects like Skywaters shaping Singapore’s skyline, our piece on mega developments in Singapore is a good companion read. You’re also welcome to browse our full range of luxury condos for sale in Singapore if you’re comparing branded and non-branded options side by side.

Advanced Heading

Frequently Asked Questions

How many branded residences are there in Singapore?

Just four completed developments existed before 2025: St Regis Residences, Ritz-Carlton Residences, Pullman Residences Newton, and The Residences at W Singapore Sentosa Cove. Two more, W Residences Marina View and Aman Singapore at Skywaters Residences, are on the way.

A branded residence is fully owned, with unlimited personal use and hotel-grade services layered on top. A hotel residence is typically structured as a sale-and-leaseback investment product, with limited personal use and shared rental income.

Not always. While branded residences can command significant premiums globally, Singapore transaction data from 2022 to 2025 shows mixed results, with some non-branded luxury projects matching or beating branded ones on price growth.

Aman Singapore, the ultra-luxury hospitality brand’s first-ever Singapore property, is set to open within The Skywaters at 8 Shenton Way, alongside W Residences Marina View as the fifth branded residence overall.

Land scarcity through Government Land Sales limits the large, prominent sites branded projects typically need. Singapore’s established local developers also carry strong pricing power on their own, reducing the incentive to license an external brand.

Typically round-the-clock concierge, housekeeping, in-residence dining, spa access, and elevated status on the brand’s hotel loyalty programme, alongside consistent professional building management.

It’s reasonable to expect a significant premium, given Aman deliberately limits its global residential portfolio to under 15 projects to preserve exclusivity, and this marks the brand’s first entry into Singapore.

Be cautious about assuming the brand alone guarantees stronger returns. Singapore data suggests fundamentals like tenure, layout, and location still matter more than brand association for long-term capital appreciation.

It varies by project, so this needs to be checked individually. Tenure remains one of the fundamentals that affects long-term value regardless of whether a development carries a hospitality brand.

St Regis Residences on Tanglin Road, completed in 2008, holds that title and remains one of the most recognised branded addresses in Singapore today.

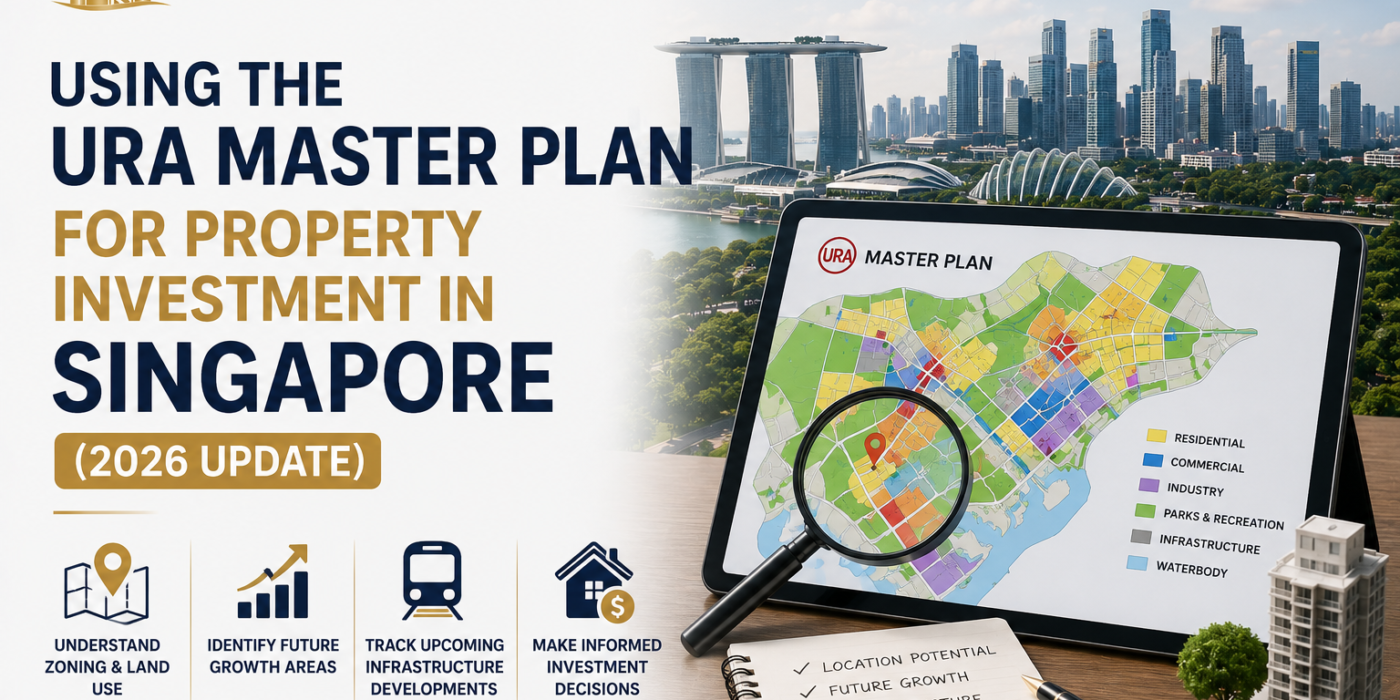
Using the URA Master Plan for Property Investment in Singapore
Categoriesarticles

Using the URA Master Plan for Property Investment in Singapore (2026 Update)

TL;DR: The URA Master Plan is Singapore’s statutory land use blueprint, updated every five years, showing how every plot of land will be used for the next 10 to 15 years. The current version is the Draft Master Plan 2025, exhibited from November 2024, which confirms Jurong Lake District as Singapore’s second CBD, expands Woodlands Regional Centre, and adds a green corridor along Orchard Road. Smart investors use the URA Master Plan to spot transformation zones before prices catch up, focusing on plot ratio increases, new MRT lines, and confirmed (not just proposed) infrastructure spend, then buy early and hold through the multi-year transformation window.

Every seasoned property investor in Singapore has one document permanently bookmarked, and it isn’t a listing site. It’s the URA Master Plan. If you’ve never actually opened it, you’re essentially investing with one eye closed, because this is the closest thing to a crystal ball the property market actually offers.

At SG Luxury Condo, this is the first thing we pull up with clients weighing where to invest next, before we even talk about specific projects. Here’s how to actually read it, and more importantly, how SG Luxury Condo uses it to spot opportunities before the rest of the market catches on.

What the URA Master Plan Actually Is

Changes-in-Masterplan

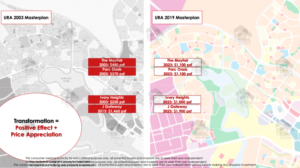
The URA Master Plan is a statutory land use plan prepared under the Planning Act, defining what can legally be built on every piece of land in Singapore for the next 10 to 15 years. It’s reviewed every five years, translating the broader, longer-term Long-Term Plan into the specific, ground-level detail that actually shapes what gets built where.

A few components matter most if you’re using it for property investment:

  • Zoning colours – residential, commercial, business, and civic & community land uses are each colour-coded, so you can instantly see what’s planned around a specific plot
  • Plot ratio (Gross Plot Ratio, or GPR) – the ratio of total floor area allowed against the land size. A plot ratio of 2.8 means a developer can build 2.8 times the land area in gross floor space. Higher plot ratios generally mean more units, and more value, for that piece of land
  • White sites – flexible zoning that permits a mix of commercial, residential, hotel, and recreational use, often found in the Core Central Region and typically signalling a future integrated, higher-value development
  • URA Space – the free, interactive online map tool where you can search any address and see its current zoning, plot ratio, and any confirmed or draft amendments layered on top

The Draft Master Plan 2025: What’s Actually New

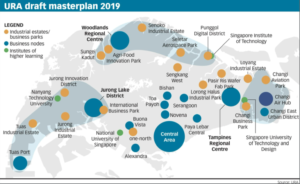
URA-Draft-masterplan-

The current version, Draft Master Plan 2025, was exhibited to the public from November 2024, and it’s worth knowing the headline changes if you’re making an investment decision today.

Area

Key Change

Why It Matters for Investors

Jurong Lake District

Confirmed as Singapore’s second CBD

Sustained mixed-use growth through the 2030s, boosted further by the Jurong Region Line

Woodlands Regional Centre

Expanded as the largest northern hub

Long growth runway, better suited to patient, longer-horizon investors

Orchard Road

New 2.4km green urban corridor, possible car-free sections

District 9 properties along this stretch gain a lasting amenity uplift

Bishan

Slated as a sub-regional centre with added office space

More daytime footfall and commercial spillover for nearby residential units

Holland Village

Rejuvenation with new residences and retail

A rare new supply injection into a historically undersupplied enclave

We’ve broken this specific draft down in far more detail, area by area, in our dedicated guide on the URA Draft Master Plan 2025, which pairs well with the investment strategy covered here.

The Two Things We Always Check First

When SG Luxury Condo reviews the URA Master Plan for a client, two factors matter more than anything else on the page.

  1. Transformation – Identify nearby future growth areas that could lift property value. If the government is investing serious infrastructure money into a location, that’s usually a strong signal worth following.
  2. Rejuvenation – Look for older buildings with genuine en bloc potential, or vacant land earmarked for new residential development. Both tend to push surrounding property prices upward over time. If you’re specifically weighing a purchase for its redevelopment upside, our guide on the pitfalls of buying a property just for en bloc potential is worth reading first, since this strategy carries real risks of its own.

Five Filters for Spotting a Genuine Growth Opportunity

Not every highlighted zone on the Master Plan turns into a strong investment. Here’s how we separate the real opportunities from the ones that look good on paper but never quite materialise.

  • Is the regeneration actually funded? Planning permission alone means little. Years, sometimes decades, can pass before a site with only planning approval sees a shovel in the ground.
  • Is the scale large enough? A small, isolated project rarely moves the needle on surrounding property values or rents.
  • Is the development broad-based? The strongest transformation zones combine residential, commercial, leisure, schools, and transport, not just another apartment block.
  • Are you prepared to take a long view? To capture the full upside, you generally need to buy early and hold for a decade or more before, if no further investment follows, the area’s growth story plateaus.
  • Is a proven developer involved? Large-scale transformation is rarely pulled off successfully by smaller, less-established developers.

No location checks every one of these boxes perfectly. The real skill is buying in when you have genuine conviction the area is changing, but before the property portals and “expert” columns start writing about it, a skill SG Luxury Condo has built up across countless transformation zones over the years.

Timing Your Entry: The Three Phases of Urban Transformation

Every transformation zone moves through roughly the same three phases, and where you enter matters enormously for your eventual return.

Phase

What’s Happening

Price Behaviour

Pre-transformation

Confirmed plans exist, but visible construction hasn’t started

Prices still low, awareness limited, biggest upside available

Mid-development

MRT lines, roads, and malls actively under construction

Prices climbing steadily as the story becomes visible

Post-completion

Area is “hot,” infrastructure is live

Prices already reflect the future value; upside is mostly captured

Buying in Phase 1, or early Phase 2, generally captures the most appreciation. Waiting until Phase 3 means you’re paying today for gains that already happened.

Regional Snapshot: Where the Growth Stories Sit Today

North

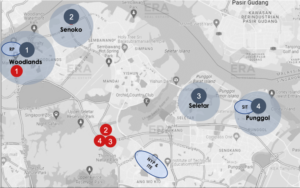
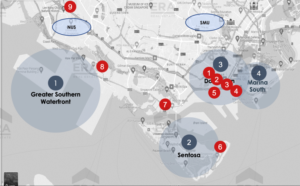
North – Woodlands Regional Centre remains a long-horizon play, likely needing 15 to 20 years for its full growth story to play out, though it’s well suited to patient investors. Punggol continues to offer a steadier, shorter-horizon growth path over the next decade.

west

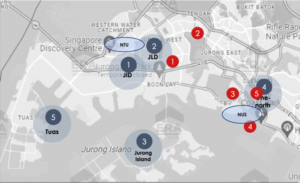
West – Jurong Lake District’s confirmation as a second CBD is the single biggest growth story on the current Master Plan. Watch land prices carefully though, some pockets close to the core have already run up significantly, so the outskirts, Jurong West, Boon Lay, and Lakeside, may offer better relative value today.

east

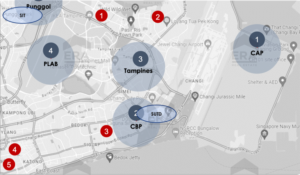
East – Changi Business Park, the Changi Aviation Hub, and the Cross Island Line’s eastern stretch are gradually knitting Pasir Ris, Tampines, and the Changi area more tightly into the rest of the island. These pockets still trade at relatively affordable levels for what’s coming.

south

South – The Greater Southern Waterfront remains a genuinely long-term story, likely 15 to 20 years out, since the land itself, formerly Tanjong Pagar and Pasir Panjang port sites, is still being progressively cleared for redevelopment.

Crafting Your Exit Strategy

Exit-Strategy-Planning

A clear exit strategy matters just as much as your entry timing. Coordinating your investment horizon with the Master Plan’s own milestones is how you actually capture the appreciation you were betting on in the first place.

A short 3 to 5 year hold works better in areas already mid-transformation, where infrastructure is visibly landing soon. A longer-horizon, patient hold suits areas still in the pre-transformation phase, where the full growth story may take a decade or more to unfold, but the entry price reflects that uncertainty.

A Word From SG Luxury Condo

The URA Master Plan is genuinely one of the most powerful, and most underused, tools available to Singapore property investors, precisely because it’s entirely public and free to access. The investors who consistently do well with it aren’t the ones with insider information, they’re the ones patient enough to buy early, hold through the noisy middle years, and exit once the transformation story has actually played out.

If you’re weighing a specific district against what the current Master Plan actually confirms, versus what’s still just proposed, SG Luxury Condo is happy to walk through it with you. Our property consultation sessions cover exactly this kind of location analysis, and our Property P.L.U.S System combines Master Plan research with the numbers side of due diligence so you’re not relying on either alone. You’re also welcome to browse our full range of luxury condos for sale in Singapore if you’re ready to start shortlisting against these growth corridors.

Advanced Heading

Frequently Asked Questions

How often is the URA Master Plan updated?

Every five years. The current version is the Draft Master Plan 2025, exhibited from November 2024, with the last full revision before that being Master Plan 2019.

The Long-Term Plan sets Singapore’s broad strategic direction over 50 years. The Master Plan translates that into detailed, medium-term (10 to 15 year) land use and zoning decisions that actually guide what gets built where.

Plot ratio, or Gross Plot Ratio, determines how much floor area can legally be built on a piece of land relative to its size. A higher plot ratio generally means the land can support more units or floor space, which tends to make it more valuable to developers, especially relevant if you’re evaluating en bloc potential.

A white site permits flexible mixed use, commercial, residential, hotel, or recreational, at the developer’s discretion. These typically signal a future higher-value, integrated development and are more common in the Core Central Region.

It’s one of the most reliable public tools available, but it’s not a guarantee. Confirmed, funded infrastructure tends to correlate strongly with future appreciation, but timelines can slip, and not every zoned transformation reaches its full potential on schedule.

Use URA Space, the free interactive map tool on URA’s website. Search the address directly to see its current zoning, plot ratio, and any gazetted or draft amendments layered on top.

It confirms JLD as Singapore’s second Central Business District, with sustained mixed-use development planned through the 2030s, further supported by the Jurong Region Line’s phased opening.

It depends on your investment horizon. Pre-transformation areas offer the biggest theoretical upside but require more patience, often a decade or more. Mid-development areas cost more upfront but usually deliver a faster, more predictable return within 3 to 5 years.

Yes, indirectly. A plot zoned with a higher allowable plot ratio than what’s currently built often signals genuine redevelopment upside, one of the key ingredients agents look at when assessing en bloc potential, alongside tenure and building age.

Our dedicated breakdown of the URA Draft Master Plan 2025 covers each new neighbourhood and investment opportunity in far more depth than a general strategy guide like this one can.

Mortgage Affordability Calculator Singapore
Categoriesarticles

Mortgage Affordability Calculator Singapore: How Much Home Loan Can You Actually Get?

Mortgage Affordability Calculator

Affordability Calculator

Find out the maximum amount you can loan and what you can afford to buy. Affordability Calculator is based on private residential property.

Main Applicant
Eg; 35
Eg; 8,000
Eg; 5,500
Joint Applicant (if any)
Eg; 35
Eg; 8,000
Eg; 5,000
Total Debt Servicing Ratio (TDSR)
Affordability


*Max Loan Amount can be increased using other legal funding techniques if required. Contact us for more information.
*Max Loan Amount is based on assumption that you currently do not have any other existing housing loan.
^The results provided by this calculator assume the accuracy of the users inputs and are based on corresponding rules and regulations as set out by the Monetary Authority of Singapore (MAS). The results are provided as a general basis for information and does not constitute an approval from any bank or financial institution. Results as indicative and for illustrative purposes. Any person acting upon or in reliance of this information does so entirely at their own risk. No warranty whatsoever is given and no liability is accepted by us behind this calculator for any loss arising directly or indirectly as a result of any action or omission made in reliance of any information presented herein at any time.

“How much can I actually borrow?” It’s usually the very first question a client asks us at SG Luxury Condo, often before they’ve even picked a district. Fair enough, since there’s no point falling in love with a $2.5 million unit if the bank is only going to lend you enough for a $1.8 million one.

That’s exactly what our mortgage affordability calculator is built to answer. It’s not a rough guess, it’s based on the actual rules the Monetary Authority of Singapore requires every bank to follow. Once you understand how the calculation actually works, the number stops feeling like a mystery and starts feeling like a plan, which is exactly why SG Luxury Condo runs this calculation with clients before anything else.

TL;DR: Singapore’s mortgage affordability calculator works out your maximum home loan using MAS’s Total Debt Servicing Ratio (TDSR) framework, capping your total monthly debt at 55% of gross income, stress-tested at a 4% interest rate regardless of your actual mortgage rate. HDB flats and Executive Condominiums also face a separate 30% Mortgage Servicing Ratio (MSR) cap that private condos don’t. On top of TDSR, the bank will only lend up to 75% of the property’s value (Loan-to-Value ratio), so you’ll need at least 25% in cash or CPF for the rest. Run both numbers before you start viewing units, not after.

What a Mortgage Affordability Calculator Actually Calculates

A proper mortgage affordability calculator in Singapore isn’t estimating what you’d like to spend. It’s applying MAS’s TDSR framework to your actual income and debt to work out the maximum loan a bank is legally allowed to extend you. Two numbers come out the other end: your maximum loan tenure, and your maximum loan amount.

Here’s the thing most first-time buyers don’t realize. This number reflects your loan eligibility, not your full property budget. You’ll still need to factor in your downpayment, Buyer’s Stamp Duty, and possibly Additional Buyer’s Stamp Duty on top of whatever the bank approves.

The TDSR Framework, Explained Simply

Total Debt Servicing Ratio, or TDSR, caps how much of your gross monthly income can go toward all your debt obligations combined, home loan, car loan, personal loan, credit card debt, the lot. It applies to every residential property loan in Singapore, HDB and private alike.

TDSR Component

Rule

Maximum TDSR

55% of gross monthly income

Stress-test interest rate

4.0% per annum for private residential loans, regardless of your actual rate

Variable income haircut

Only 70% of bonuses, commissions, or rental income counts

Maximum loan tenure (private)

35 years, or 65 minus your age, whichever is shorter

Joint applications

Combined income and debt of all applicants used

The stress-test rate is the part that trips people up most. Even if your bank offers you a mortgage at 1.8%, MAS requires the calculation to assume you’re paying 4%, since mortgages run for decades and rates won’t stay low forever. This protects you from over-borrowing, but it also means the maximum loan amount a mortgage affordability calculator gives you will almost always be lower than what your actual monthly repayment might suggest you can afford.

MSR: The Extra Layer for HDB and EC Buyers

If you’re eyeing an HDB flat or an Executive Condominium bought directly from a developer, there’s a second, stricter cap to clear first: the Mortgage Servicing Ratio (MSR).

  • MSR limits your monthly home loan repayment alone to 30% of gross monthly income
  • It only applies to HDB flats and new ECs, private condos and resale ECs after privatisation are exempt
  • For most HDB upgraders, MSR ends up being the binding constraint, not TDSR, since 30% is a tighter ceiling than 55%
  • This is actually one reason some upgraders skip ECs entirely and go straight for a private condo, since MSR doesn’t apply and their full TDSR headroom becomes available instead

A Worked Example

Numbers make this easier to picture, so here’s a simplified example using a couple applying jointly.

  • Combined gross monthly income: $16,000 ($10,000 fixed + $6,000 average variable, haircut to 70% = $4,200 counted)
  • Existing debt: $500/month car loan
  • TDSR cap: 55% x ($10,000 + $4,200) = $7,810/month
  • Available for mortgage servicing: $7,810 − $500 = $7,310/month
  • Maximum loan tenure: 35 years (assuming both applicants are under 30)
  • Maximum loan amount at 4% stress rate: roughly $1.63 million

That $1.63 million is the bank’s ceiling, not your full property budget. Add in your 25% downpayment requirement under the Loan-to-Value rules, and this couple could realistically be looking at properties priced up to roughly $2.17 million, before accounting for stamp duties.

Don’t Forget the Loan-to-Value (LTV) Overlay

TDSR tells you your maximum loan based on income. LTV tells you your maximum loan based on the property’s value, and the bank always uses whichever number is lower.

Buyer Profile

Maximum LTV

Minimum Cash/CPF Downpayment

First home loan, tenure within age 65

75%

25%

First home loan, tenure extends past 65 or exceeds 30 years

55%

45%

Second outstanding home loan

45%

55%

Third or subsequent home loan

35%

65%

This is exactly why running both a mortgage affordability calculator and an LTV check matters. Passing TDSR comfortably means nothing if you don’t have enough cash or CPF set aside to cover the LTV shortfall on a specific property.

Common Mistakes When Using an Affordability Calculator

We see these same mix-ups repeat themselves constantly, so SG Luxury Condo walks through each one with clients before they get too far into a decision.

  • Assuming your actual mortgage rate applies. It doesn’t, MAS requires the 4% stress-test rate regardless of the promo rate your bank is quoting you today.
  • Forgetting the variable income haircut. Bonuses and commissions only count at 70% of their value, not the full amount.
  • Ignoring existing debt. Car loans, personal loans, and even credit card balances all reduce your available TDSR headroom.
  • Mixing up TDSR and MSR. If you’re buying an HDB flat or new EC, MSR usually kicks in as the tighter limit, not TDSR.
  • Not accounting for a second property loan. If you already have an outstanding home loan, your LTV drops sharply, from 75% down to 45% or even 35%.
  • Treating the calculator’s ceiling as the target. The maximum loan figure is what the bank permits, not necessarily what fits comfortably into your monthly budget alongside everything else you’re paying for.

How to Use Our Mortgage Affordability Calculator

Getting an accurate result takes about two minutes, and it’s the same process SG Luxury Condo walks every new client through. Here’s what you’ll need on hand:

  1. Your age, and your co-applicant’s age if buying jointly, since this determines your maximum loan tenure
  2. Gross monthly fixed income for each applicant
  3. Annual variable income, such as bonuses or commissions, for each applicant
  4. Any existing monthly debt obligations, car loans, personal loans, or other credit facilities

Once you’ve entered these, the calculator applies the current MAS TDSR framework automatically and returns your weighted average age, combined gross monthly income, 55% TDSR limit, and your maximum loan amount and tenure. From there, our mortgage calculator can show you exactly what your monthly repayment would look like once you’ve settled on a specific purchase price.

Beyond the Loan: What Else Affects Your Total Budget

Passing TDSR and LTV is only part of the equation. Your total cash outlay also needs to cover Buyer’s Stamp Duty, and Additional Buyer’s Stamp Duty if it applies to your buyer profile. Our ABSD rates calculator can show you exactly how much extra you’d owe based on your citizenship status and how many properties you already own, which is worth checking before you finalise your maximum property budget.

A Word From SG Luxury Condo

We run this exact calculation with nearly every client before they start viewing units, because falling for a property you technically can’t get approved for wastes everyone’s time, including yours. A mortgage affordability calculator gives you the ceiling. What you actually want to spend, and what leaves you comfortable month to month, is usually a bit below that ceiling, not right up against it.

If your numbers are borderline, or you’re weighing a joint application, a second property purchase, or how decoupling might change your loan eligibility, SG Luxury Condo is happy to walk through the details with you. Our property consultation sessions cover exactly this kind of financing question, and our Singapore property investment advisors can help you plan a purchase that fits comfortably within your actual budget, not just your maximum eligibility. You’re also welcome to browse our full range of luxury condos for sale in Singapore once you know your numbers.

Advanced Heading

Frequently Asked Questions

What's the difference between TDSR and MSR?

TDSR caps all your monthly debt obligations, including the new home loan, at 55% of gross income, and applies to every residential property loan. MSR caps only the home loan repayment at 30% of gross income, and applies solely to HDB flats and new ECs bought from a developer.

MAS requires banks to stress-test your loan using a medium-term interest rate floor of 4% for private residential property, regardless of the promotional rate you’re offered. This ensures you can still service the loan if rates rise over its multi-decade tenure.

No, only 70% of variable income like bonuses, commissions, or rental income is counted. The remaining 30% is excluded as a buffer against income volatility.

The maximum loan amount is what the bank will lend you. Your maximum property budget is higher, since you’ll add your downpayment, using cash or CPF, on top of that loan amount, minus stamp duties and other purchase costs.

Yes, joint applications combine both applicants’ income and debt, and use a weighted average age to determine the maximum loan tenure. This often increases the overall loan amount compared to a single applicant.

Your Loan-to-Value ratio drops significantly, from 75% for a first loan down to 45% for a second outstanding loan, and 35% for a third. This means you’ll need a much larger cash or CPF downpayment for a subsequent property.

Private condos are only subject to TDSR. HDB flats and new ECs also face the additional MSR cap of 30%, which is often the tighter, binding constraint for these buyer types.

It’s generally very close, since it applies the same MAS-mandated TDSR and stress-test rules banks are required to follow. The final approved amount can still vary slightly based on the bank’s own credit assessment and documentation.

Typically your latest payslips or Notice of Assessment, CPF contribution history, existing loan statements, and identification documents. Getting an In-Principle Approval (IPA) from a bank confirms your actual eligibility before you commit to a purchase.

Not necessarily. The calculator shows your ceiling under MAS rules, not necessarily what’s comfortable for your lifestyle. Many buyers deliberately borrow below their maximum eligibility to leave a cushion for other expenses and unexpected life changes.

How to Spot Value in Singapore New Launch Condominiums
Categoriesarticles

How to Spot Value in Singapore New Launch Condominiums

Executive Summary

Buying a first condominium is one of the largest financial decisions most Singapore households will make. Yet many buyers enter a sales gallery without a clear way to judge whether a new launch is reasonably priced. They may compare only the headline price, the monthly instalment, or the discount offered on launch weekend. A more useful starting point is the price paid for the land.

This report studies 40 major condominium launches from 2018 to 2025, using five projects for each year. For every project, the dataset records the land price in dollars per square foot per plot ratio, the average selling price in dollars per square foot, and the selling-price-to-land-price multiplier. The purpose is not to predict the exact price of every future launch. The purpose is to build a practical benchmark that helps a first-time buyer ask better questions.

The yearly results show a clear change. From 2018 to 2020, the average selling price was about 1.8 times the average land price. In 2021, the multiplier rose to about 2.0 times. In 2022, it fell to about 1.75 times because the sample contained projects with high land costs relative to their selling prices. From 2023 to 2025, the multiplier recovered from 1.91 times to 2.24 times.

This widening gap should not automatically be read as evidence that developers are earning much larger profits. Land is only one part of the total development cost. Developers also pay for construction, labour, professional fees, financing, marketing, regulatory compliance, taxes, contingencies and the risk of holding unsold units. Construction tender prices and imported material costs rose sharply after the pandemic, while interest rates increased from the unusually low levels seen before 2022. Global trade restrictions and tariffs can also raise the price of imported materials and equipment, although the exact effect varies by project.

For practical use, a buyer can multiply the land price by a broad benchmark. Before 2022, 1.8 times was a reasonable first estimate. For recent launches, 2.2 times is a more relevant starting point. A launch priced clearly below 2.2 times its land price may deserve closer study as a possible value opportunity. However, this is only a screen. A buyer must still consider location, tenure, transport, schools, site quality, unit efficiency, competition, maintenance fees and resale demand.

Important caution: This framework estimates relative pricing. It does not prove that a property is cheap, guarantee capital gains, or replace a full affordability and suitability check.

At a Glance

Core idea: A developer’s land price is a useful starting point for estimating a future launch price. In this dataset, the typical multiplier moved from about 1.8× before 2022 to about 2.2× by 2025.


Projects analysed

40

Study period

2018–2025

Projects per year

5

Average multiplier in 2018

1.87×

Average multiplier in 2025

2.24×

1. Why Land Price Matters to a First-Time Condo Buyer

A new condominium price can feel mysterious. Buyers usually see the finished product: the show flat, the pool, the landscaping, the smart-home features and the promotional price list. The developer, however, started making decisions years earlier. One of the earliest and most important decisions was how much to pay for the site.

In Singapore, many new private housing sites are sold through the Government Land Sales programme. Developers submit bids for the land. The winning bid is commonly reported as dollars per square foot per plot ratio, or psf ppr. This measure adjusts the land price for the amount of floor area that can be built. A higher psf ppr usually means the developer starts with a higher land cost for every square foot of saleable space it hopes to create.

Land price is useful because it is public, measurable and fixed early. It gives buyers a base from which to estimate the likely launch price. If two sites are similar in location, tenure and planning conditions, the site bought at the higher psf ppr will usually need a higher selling price. The relationship is not exact, but it is meaningful.

The mistake is to assume that selling price equals land price plus a small mark-up. A condominium is not a piece of raw land sold directly to a buyer. The developer must turn that land into a completed and legally compliant residential project. This process takes years and includes design, approvals, construction, financing, sales, landscaping, infrastructure, taxes and risk. Therefore, the gap between land price and average selling price is not pure profit.

For a first-time buyer, land price is best treated as an anchor. It is similar to knowing the cost of ingredients before judging the price of a restaurant meal. The ingredients matter, but they are not the whole bill. When buyers understand this, they can avoid two common errors. The first is thinking that every project above its land price is overpriced. The second is accepting any high price simply because construction costs have increased. A disciplined buyer uses land price as a starting point, then checks whether the remaining premium is justified.

2. Research Method and Dataset

The analysis uses 40 project entries from 2018 to 2025, with five launches for each year. The workbook records the project name, total units, district, market region, tenure, developer, land price, average selling price and the ratio of average selling price to land price.

The intended screening approach was to focus mainly on larger projects with more than 400 units and to remove unusual cases such as boutique projects, en bloc redevelopments and mixed developments. Larger projects were preferred because they tend to have more transactions, a broader mix of buyers and more reliable average selling-price observations. Small boutique developments can produce misleading averages because a few premium units may heavily influence the result.

However, the final 40-row workbook still contains a small number of executive condominiums and mixed-use or integrated projects. Examples include Piermont Grand, Parc Central Residences, Tenet, CanningHill Piers, Lentor Modern and ParkTown Residence. These entries are reproduced faithfully because they remain in the supplied dataset. Readers should therefore view the results as an applied market sample rather than a perfectly controlled academic sample.

The average land price for each year is calculated by adding the five land prices and dividing by five. The average selling price is calculated in the same way. The main multiplier is then calculated as average selling price divided by average land price. This method is different from averaging the five individual project ratios, although the results are usually close.

The study also shows the inverse ratio, land price divided by average selling price. This tells us what share of the selling price is represented by the land-price benchmark. For example, an inverse ratio of 0.45 means the average land price is about 45 percent of the average selling price. It does not mean land is exactly 45 percent of the developer’s total cost, because psf ppr and saleable psf are not perfectly identical concepts and because project efficiency varies.

The dataset is designed as a practical decision tool. It is not a valuation report, and it does not estimate developer profit margins. Average selling prices may refer to launch-period averages, reported averages or broad project averages depending on the original source. Different unit sizes, floor levels, views and sales phases can also affect the reported psf.

3. The 40 New Launch Condominium Entries

The following table reproduces the dataset used in this report. The multiplier is calculated as average selling price divided by land price.

Year

Project

Units

Region

Tenure

Land price (S$ psf ppr)

Avg selling price (S$ psf)

Multiplier

2018

Riverfront Residences

1,472

OCR

99-yr

706

1,305

1.85×

2018

Stirling Residences

1,259

RCR

99-yr

1,051

1,800

1.71×

2018

Park Colonial

805

RCR

99-yr

1,100

1,700

1.55×

2018

The Tapestry

861

OCR

99-yr

565

1,310

2.32×

2018

Twin Vew

520

OCR

99-yr

592

1,399

2.36×

2019

Treasure at Tampines

2,203

OCR

99-yr

655

1,323

2.02×

2019

The Florence Residences

1,410

OCR

99-yr

842

1,447

1.72×

2019

Parc Esta

1,399

RCR

99-yr

909

1,680

1.85×

2019

Piermont Grand (EC)

820

OCR

99-yr

583

1,080

1.85×

2019

Avenue South Residence

1,074

RCR

99-yr

1,138

1,961

1.72×

2020

Clavon

640

RCR

99-yr

788

1,640

2.08×

2020

Parc Clematis

1,468

RCR

99-yr

850

1,580

1.86×

2020

Forett at Bukit Timah

633

RCR

Freehold

1,068

1,880

1.76×

2020

Penrose

566

RCR

99-yr

732

1,580

2.16×

2020

The M

522

RCR

99-yr

1,458

2,450

1.68×

2021

Normanton Park

1,862

RCR

99-yr

969

1,750

1.81×

2021

Parc Central Residences (EC)

700

OCR

99-yr

578

1,171

2.03×

2021

CanningHill Piers

696

CCR

99-yr

1,171

3,000

2.56×

2021

Midtown Modern

558

CCR

99-yr

1,535

2,800

1.82×

2021

Irwell Hill Residences

540

CCR

99-yr

1,515

2,700

1.78×

2022

Lentor Modern

605

OCR

99-yr

1,204

2,107

1.75×

2022

Leedon Green

638

CCR

Freehold

1,790

2,887

1.61×

2022

Riviere

455

RCR

99-yr

1,733

2,907

1.68×

2022

Tenet (EC)

618

OCR

99-yr

659

1,382

2.10×

2022

Piccadilly Grand

407

RCR

99-yr

1,129

2,150

1.90×

2023

Grand Dunman

1,008

RCR

99-yr

1,350

2,535

1.88×

2023

The Myst

408

OCR

99-yr

1,068

2,057

1.93×

2023

The Continuum

818

RCR

Freehold

1,440

2,733

1.90×

2023

Tembusu Grand

638

RCR

99-yr

1,302

2,473

1.90×

2023

Lentor Hills Residences

598

OCR

99-yr

1,060

2,104

1.98×

2024

Chuan Park

916

RCR

99-yr

1,256

2,579

2.05×

2024

Emerald of Katong

846

RCR

99-yr

1,069

2,621

2.45×

2024

The Continuum

818

RCR

Freehold

1,440

2,800

1.94×

2024

Lentor Mansion

533

OCR

99-yr

985

2,257

2.29×

2024

Hillock Green

474

OCR

99-yr

1,108

2,108

1.90×

2025

ParkTown Residence

1,193

OCR

99-yr

885

2,360

2.67×

2025

One Marina Gardens

937

CCR

99-yr

1,402

2,953

2.11×

2025

The Orie

777

RCR

99-yr

1,175

2,704

2.30×

2025

ELTA

501

RCR

99-yr

1,250

2,537

2.03×

2025

Lentor Central Residences

477

OCR

99-yr

982

2,200

2.24×

4. Yearly Averages and the Main Trend

The yearly summary makes the change easier to see. Each year contains five projects, so every project has equal weight in the annual average.

Year

Average land price

Average PSF

Average PSF ÷ land price

Land price ÷ average PSF

2018

S$802.8

S$1,502.8

1.87×

0.53

2019

S$825.4

S$1,498.2

1.82×

0.55

2020

S$979.2

S$1,826.0

1.86×

0.54

2021

S$1,153.6

S$2,284.2

1.98×

0.51

2022

S$1,303.0

S$2,286.6

1.75×

0.57

2023

S$1,244.0

S$2,380.4

1.91×

0.52

2024

S$1,171.6

S$2,473.0

2.11×

0.47

2025

S$1,138.8

S$2,550.8

2.24×

0.45

Figure 1. Average land price and average selling price for the five sampled projects in each year.

From 2018 to 2020, the multiplier stayed close to 1.8 times. It was 1.87 times in 2018, 1.82 times in 2019 and 1.86 times in 2020. This suggests that, across the sample, selling prices moved in a fairly stable relationship with land prices.

In 2021, the multiplier rose to 1.98 times. This was close to 2.0 times and marked a step up from the earlier period. The sample included several higher-priced central projects, which raised the average selling price.

In 2022, the multiplier dropped to 1.75 times, the lowest yearly figure in the study. The average land price reached S$1,303 psf ppr, the highest annual land-price average in the table, while the average selling price was S$2,286.60 psf. This combination compressed the multiplier. One possible interpretation is that developers had committed to expensive land before fully passing higher costs into selling prices. Another is that the mix of projects in the sample, including premium freehold and central sites, affected the result. It would be too strong to say that the entire market followed exactly the same pattern.

From 2023 to 2025, the multiplier rose steadily: 1.91 times in 2023, 2.11 times in 2024 and 2.24 times in 2025. At the same time, the average land price fell from S$1,244 psf ppr in 2023 to S$1,138.80 psf ppr in 2025, while the average selling price increased from S$2,380.40 psf to S$2,550.80 psf. In simple terms, developers achieved progressively higher selling prices relative to the sampled land costs.

Figure 2. The average multiplier increased from around 1.8× in the earlier years to 2.24× in 2025.

5. Why the Gap Between Land Price and Selling Price Has Widened

The most important point is that land price is not the only cost. The developer’s final price must cover a full development cost stack. A wider gap between land price and selling price can therefore be caused by higher non-land costs even when the developer’s profit margin does not increase.

Construction cost is the most visible part of this gap. A condominium requires concrete, reinforcement steel, glass, aluminium, mechanical and electrical systems, lifts, waterproofing, finishes, landscaping and many other materials. It also requires skilled workers, supervisors, engineers, safety systems, testing and quality control. When material prices, wages or contractor bids rise, the developer’s breakeven price rises.

The pandemic created major disruption. Border restrictions reduced the availability of foreign workers. Worksites faced delays and additional safety measures. Shipping schedules became less reliable, and global supply chains were disrupted. Even after restrictions eased, contractors still had to rebuild capacity, clear project backlogs and manage higher input prices. These pressures did not disappear immediately.

Inflation also matters. Singapore imports many construction inputs and pieces of equipment. When international prices rise, when freight costs increase, or when the Singapore dollar does not fully offset foreign-currency price changes, imported costs can rise. General inflation also affects professional salaries, transport, energy, insurance, security, cleaning and administration.

Tariffs and trade restrictions can add another layer of cost. Singapore may not impose the relevant tariff itself, but global tariffs can change the price and routing of steel, aluminium, machinery, electrical equipment and other traded goods. Suppliers may pass these costs through the regional supply chain. The effect is indirect and differs by product, so tariffs should be treated as one possible contributor rather than the sole explanation.

Financing costs are another important reason. A developer pays for land before it receives most of the sales revenue. Construction also requires working capital over several years. When interest rates rise, the cost of holding land and financing construction increases. Higher rates also create sales risk because buyers face larger mortgage payments and may become more cautious. Developers may therefore need a wider buffer for financing and uncertainty.

Professional and regulatory costs have also grown in importance. Architects, engineers, quantity surveyors, legal advisers, project managers and marketing teams all contribute to the project. Newer developments may include more advanced building systems, sustainability features, digital controls and energy-efficiency requirements. These can improve long-term performance, but they can add upfront cost.

Taxes and policy-related costs should not be ignored. Developers face stamp duties, including Additional Buyer’s Stamp Duty obligations and deadlines, depending on the land acquisition structure and prevailing rules. There are also development charges or lease-related payments for some sites. A developer that fails to sell and complete within required periods may face significant financial consequences. This risk is reflected in bidding and pricing decisions.

Marketing and sales costs are smaller than land and construction but still material. Show flats, sales galleries, commissions, advertising, legal documentation and launch events all have a cost. Large projects may benefit from scale, yet they also require large sales teams and long marketing campaigns.

Finally, the developer must earn a return for taking risk. A project can take five years or more from land purchase to completion. During that period, the economy, interest rates, regulations, buyer demand and competing supply can change. The developer must also manage defects, delays and unsold inventory. Profit is therefore not simply an excessive add-on; it is the return required to undertake a complex, capital-intensive project. The correct question is not whether the selling price is above land cost. The correct question is whether the total premium above land cost is reasonable for the project and market conditions.

6. What the Correlation Does—and Does Not—Tell Us

Figure 3. Across the 40 entries, land price and average selling price show a positive correlation of about 0.89.

Across the 40 entries, the correlation between land price and average selling price is approximately 0.89. This is a strong positive relationship. In general, projects built on more expensive land were sold at higher prices.

However, correlation is not the same as a pricing formula. The points do not lie on one perfect line. A project can sit above or below the trend because of location, tenure, views, unit sizes, design, timing, developer brand and competition. A freehold project may command a different premium from a 99-year leasehold project. A project beside an MRT station may command a higher price than a less connected project with the same land cost.

The sample also mixes CCR, RCR and OCR locations. A central project may have higher land and selling prices, while an OCR project may have a lower land cost but a large percentage premium because buyers compare it with nearby resale alternatives rather than central projects. Executive condominiums are governed by different eligibility and pricing conditions, which can also affect their multipliers.

For a first-time buyer, the correct use of correlation is simple: land price matters a lot, but it does not explain everything. It is the first checkpoint, not the final answer.

Figure 4. Most project-level multipliers in the sample fall roughly between 1.7× and 2.4×.

7. How to Estimate the Likely Selling Price of a New Launch

The most practical use of this study is to estimate a likely launch price before the official price list is released. The method is simple:

Estimated average selling price = land price × selected multiplier.

The multiplier should depend on the period and the nature of the project. Before 2022, a broad estimate of 1.8 times worked reasonably well for the sampled annual averages. By 2024 and 2025, a multiplier near 2.2 times was more consistent with the observed data.

Suppose a developer buys a residential site at S$1,000 psf ppr. Using the older 1.8-times rule, the estimated selling price would be about S$1,800 psf. Using a current 2.2-times benchmark, the estimate would be about S$2,200 psf.

Suppose the land price is S$1,300 psf ppr. Under the older rule, the estimate would be S$2,340 psf. Under the 2.2-times rule, the estimate would be S$2,860 psf.

Suppose the land price is S$1,500 psf ppr. The older estimate would be S$2,700 psf, while the newer estimate would be S$3,300 psf.

These numbers are not forecasts with guaranteed accuracy. They are quick screening estimates. A project with a complex integrated development, a costly underground connection, difficult soil conditions, premium architecture or a long construction programme may require a higher multiplier. A highly efficient site, a lower-cost construction contract or a developer seeking rapid sales may support a lower multiplier.

The average launch price also differs from the price of an individual unit. Small units often have a higher psf because fixed costs are spread over fewer square feet. High-floor units, premium stacks and better views usually cost more. A buyer should compare the selected unit with similar units in the same project, not only with the project-wide average.

8. A Practical Value-Screening Strategy: Look Below 2.2×

The central pricing strategy from this study is to compare a new launch’s expected or actual average selling price with 2.2 times its land price.

If the launch is meaningfully below 2.2 times, it may offer relative value against recent market norms. For example, if the land price is S$1,200 psf ppr, the 2.2-times benchmark is S$2,640 psf. If the project launches at an average near S$2,450 psf, the multiplier is about 2.04 times. That is below the recent benchmark and deserves closer examination.

The word “deserves” is important. A lower multiplier is not automatically a bargain. The project may have a weaker location, awkward site shape, less efficient layouts, high maintenance fees, poor views or heavy nearby supply. It may also be priced lower because the developer wants a fast launch rather than because the project is fundamentally undervalued.

The reverse is also true. A project above 2.2 times is not automatically overpriced. A premium may be justified by freehold tenure, direct MRT access, a rare central location, exceptional views, strong schools, an integrated transport hub or limited competing supply. Buyers should ask whether the extra premium is matched by real benefits that future resale buyers will also value.

A useful classification is:

  • Below 2.0 times: potentially attractive relative pricing, but investigate why it is low.
  • About 2.0 to 2.2 times: broadly within a reasonable recent range for many large launches.
  • Above 2.2 times: requires stronger project-specific justification.
  • Above 2.4 times: a high premium in this dataset; buyers should be especially careful to identify the source of value.

This classification is a guide, not a hard rule. It works best when comparing projects of similar tenure, location and development type.

9. First-Time Buyer Checklist

A first-time buyer should combine the land-price screen with a broader review. The following steps keep the process simple and disciplined.

  • Find the land price in S$ psf ppr from the Government Land Sales result or a reliable property-news report.
  • Multiply the land price by 2.2 to create a current benchmark.
  • Compare the benchmark with the project’s reported average launch price, not only the cheapest advertised unit.
  • Calculate the actual multiplier: average selling price divided by land price.
  • Compare the project with nearby new launches and recent resale transactions.
  • Check whether the project is 99-year leasehold, freehold or an executive condominium.
  • Study the unit layout. Efficient usable space can matter more than a lower psf.
  • Check MRT access, schools, shops, parks, noise, traffic and future construction around the site.
  • Estimate monthly mortgage payments under a higher interest-rate scenario.
  • Include buyer’s stamp duty, legal fees, renovation, maintenance fees and emergency savings.
  • Ask whether the project will still appeal to resale buyers five to ten years later.
  • Do not buy only because of a launch-day discount or fear of missing out.

10. Useful Discussion of the 2018–2025 Pattern

The data suggests that the new-launch market went through several phases.

The 2018–2020 period was relatively stable in multiplier terms. The annual figures stayed close to 1.8 times even though individual projects varied widely. This implies that a buyer using land price as a guide could obtain a fairly consistent first estimate.

The 2021 increase to about 2.0 times may reflect a combination of stronger private housing demand, a change in project mix and rising non-land costs. It also came during a period when the property market was recovering from the first pandemic shock.

The 2022 drop to 1.75 times is especially interesting. The average land price in the sample was the highest of the eight years. When developers buy land aggressively, they have less room between the land benchmark and the final selling price. They may accept a thinner buffer, phase price increases over time or depend on future market growth. The year also marked a sharp change in interest-rate conditions. Financing became more expensive, but developers could not always pass every cost increase to buyers immediately.

From 2023 onward, the multiplier recovered strongly. This could reflect several forces acting together. First, land bids became more disciplined in some tenders. Second, construction and financing costs remained high. Third, market selling prices had already moved upward. Fourth, developers may have needed larger risk buffers because of uncertain rates, taxes, cooling measures and future supply.

The inverse ratio helps explain the same trend from another angle. Land price divided by average selling price fell from about 0.53–0.55 in 2018–2020 to 0.45 in 2025. In other words, the land-price benchmark represented a smaller share of the sampled selling price over time. The missing share was not simply profit. It represented the larger total of construction, financing, professional, regulatory, marketing and risk costs.

It is also important to compare this sample with the wider market. URA reported that overall private residential prices rose strongly in 2022 and 2023 before the pace moderated in 2024 and 2025. This supports the broader observation that launch prices have reset upward, although the exact movement differs by region and project.

The data does not prove that construction cost alone caused the multiplier to rise. It shows an association over time. Construction inflation is a strong economic explanation, but project mix, land-bidding cycles, buyer demand and developer strategy also matter. A professional analysis should distinguish between what the data directly shows and what market evidence suggests.

11. Common Mistakes When Using the Multiplier

The first mistake is reversing the formula. For this report, the main multiplier is average selling price divided by land price. A S$2,200 psf selling price on S$1,000 psf ppr land gives 2.2 times. Land price divided by selling price gives 0.45, which is useful but answers a different question.

The second mistake is comparing unlike projects. A freehold city-fringe project should not be judged against a 99-year suburban project using only one multiplier. The number is most useful when projects are otherwise similar.

The third mistake is using the cheapest “from” price. Developers may advertise one or a few lower-priced units. The project average can be much higher. A buyer should use the average price or the price of the specific unit type under consideration.

The fourth mistake is treating 2.2 times as a valuation guarantee. It is a recent benchmark from this sample, not a law. Future construction costs, interest rates and market demand may change.

The fifth mistake is ignoring absolute affordability. A project can be good value relative to land price and still be unaffordable for a particular household. Buyers should maintain emergency savings and avoid stretching their monthly cash flow.

The sixth mistake is assuming a low multiplier guarantees profit. Resale performance depends on future supply, surrounding development, lease decay, economic conditions and the price paid for the specific unit.

12. Limitations of This Study

This report has several limitations. First, the sample contains only five projects per year and focuses on best-selling or prominent launches rather than every project launched in Singapore. It may therefore over-represent projects with strong demand.

Second, average selling prices can be measured at different points in a project’s sales cycle. Launch-weekend prices may differ from later prices after discounts are removed or premium stacks are released.

Third, land price in psf ppr is not identical to cost per saleable square foot. Developers lose some gross floor area to common areas, services and facilities. Efficiency varies by site and design.

Fourth, the final workbook still includes a few EC and mixed-use projects. Their economics and pricing rules can differ from standard private condominiums. The annual averages should therefore be treated as practical market indicators rather than a pure apples-to-apples sample.

Fifth, the study does not include exact construction contracts, financing arrangements, taxes, marketing expenses or developer profit margins. It cannot calculate the true breakeven price of each project.

Sixth, the relationship may change. If construction costs fall, interest rates decline, land bids rise sharply or buyer demand weakens, the appropriate multiplier may move away from 2.2 times.

13. Conclusion: How to Spot Value in a Singapore New Launch

The 40-project dataset provides a simple but useful lesson: land price is one of the best starting points for understanding a new condominium’s likely selling price.

From 2018 to 2020, the average selling price was about 1.8 times the average land price. In 2021, the ratio moved close to 2.0 times. It fell to 1.75 times in 2022, when the sample’s average land price was especially high. From 2023 to 2025, it rose from 1.91 times to 2.24 times.

The widening gap between land price and average selling price is consistent with higher construction costs, labour expenses, financing costs and inflation. Global tariffs and trade restrictions can also add pressure to imported material and equipment costs, although their impact is indirect and project-specific. The gap should therefore not be treated as pure developer profit.

For a quick estimate, buyers can multiply the land price by a benchmark. Before 2022, 1.8 times was a reasonable first estimate for this sample. For recent launches, 2.2 times is a more relevant starting point.

To spot possible value, look for projects priced below about 2.2 times their land price. Then investigate why. If the project also has a strong location, efficient layouts, acceptable maintenance fees, good transport and realistic resale demand, the lower multiplier may represent genuine value. If the project has major weaknesses, the lower price may simply reflect those weaknesses.

The best first-time buyers do not rely on one number. They use the multiplier to create a disciplined first screen, then combine it with affordability, location, unit quality and long-term demand. That approach is more reliable than buying because of a crowded show flat, a limited-time discount or a fear of missing out.

14. Worked Examples for First-Time Buyers

The following examples show how a buyer can use the land-price multiplier without treating it as a perfect valuation model. The numbers are simplified so that the method is easy to follow.

Example A: A suburban 99-year project

Assume a developer wins a suburban Government Land Sales site at S$900 psf ppr. Multiplying by 2.2 gives an estimated average selling price of about S$1,980 psf. If the developer later launches the project at an average of S$1,900 psf, the actual multiplier is about 2.11 times. On the surface, this is below the recent 2.2-times benchmark and may look attractive.

The buyer should then ask why the price is lower. The project may be launched early to build sales momentum. It may also face nearby competition, have less efficient layouts or be farther from an MRT station. If the project still has good transport, sensible maintenance fees and strong family demand, the lower multiplier could represent genuine relative value.

Example B: A city-fringe project with a higher land cost

Assume a city-fringe site is purchased at S$1,300 psf ppr. A 2.2-times estimate gives S$2,860 psf. If the project launches at S$2,750 psf, the multiplier is about 2.12 times. This is below the benchmark, but the absolute price is still high. A first-time buyer must separate value from affordability. A property can be attractively priced relative to land cost but still require a mortgage that is uncomfortable for the household.

The buyer should compare the total purchase price of a suitable two- or three-bedroom unit, not only the psf. A more efficient unit at S$2,800 psf may cost less overall than a larger but poorly planned unit at S$2,650 psf. Total quantum, usable space and monthly cash flow often matter more than a small difference in psf.

Example C: A premium project above 2.2 times

Assume a site is bought at S$1,400 psf ppr and launches at S$3,220 psf. The multiplier is 2.30 times. This is above the recent benchmark, but it is not automatically a bad purchase. The project may offer freehold tenure, direct MRT access, rare waterfront views or a highly desirable school location.

The buyer should test whether future buyers are likely to pay for the same advantages. A premium is safer when it is attached to a lasting feature such as tenure, transport or view. A premium based mainly on decorative finishes or launch excitement may be harder to recover during resale.

Example D: A very low multiplier

Assume the land price is S$1,100 psf ppr and the average selling price is S$1,950 psf. The multiplier is only 1.77 times. This looks unusually low compared with recent years. Rather than assuming it is a bargain, investigate carefully. The project may have been bought before a major increase in construction costs, or the developer may be accepting a lower margin. It may also have difficult surroundings, weak access or a large number of competing units.

A low multiplier is therefore a signal to investigate, not a signal to buy immediately. The aim of the method is to identify projects that deserve more attention, not to replace due diligence.

How to compare two launches

Suppose Project X has land at S$1,000 psf ppr and launches at S$2,150 psf, giving a multiplier of 2.15 times. Project Y has land at S$1,200 psf ppr and launches at S$2,520 psf, giving a multiplier of 2.10 times. Project Y has the lower multiplier, but it also has the higher absolute price.

A buyer should next compare location, tenure, total unit price, layout, maintenance fee and future supply. If Project Y is beside an MRT station and Project X requires a long bus ride, Project Y may offer better long-term value despite costing more. The multiplier helps organise the comparison, but it does not choose the home.

A simple three-step decision rule

Step one is to calculate the project multiplier. Step two is to compare it with the recent 2.2-times benchmark and with nearby projects. Step three is to decide whether the project’s strengths justify any premium. This keeps the process disciplined and reduces the chance of making a decision based only on sales-gallery pressure.

For first-time buyers, the strongest use of the multiplier is psychological as well as mathematical. It creates a neutral reference point before entering the show flat. When a salesperson says that a price is attractive, the buyer can ask, “Attractive compared with what?” Land price, nearby resale prices and competing launches provide a clearer answer than promotional language.

References and Data Notes

  • Building and Construction Authority (BCA), Key Construction Information: Construction Demand, Tender Price Index and Construction Materials.
  • Urban Redevelopment Authority (URA), Release of 4th Quarter 2024 Real Estate Statistics, 24 January 2025.
  • Urban Redevelopment Authority (URA), Release of 4th Quarter 2025 Real Estate Statistics, 23 January 2026.
  • Monetary Authority of Singapore (MAS), Measures to Promote Sustainable Conditions in the Property Market, 29 September 2022.
  • Singapore Department of Statistics, Construction Material Market Prices and related construction statistics.
  • Project-level land and selling-price figures: supplied 40-project workbook compiled from EdgeProp Singapore project-news coverage and related market reporting.

Disclaimer: This report is for general education and research. It is not financial, legal, tax or property-investment advice. Figures are approximate and should be independently checked before any purchase decision.

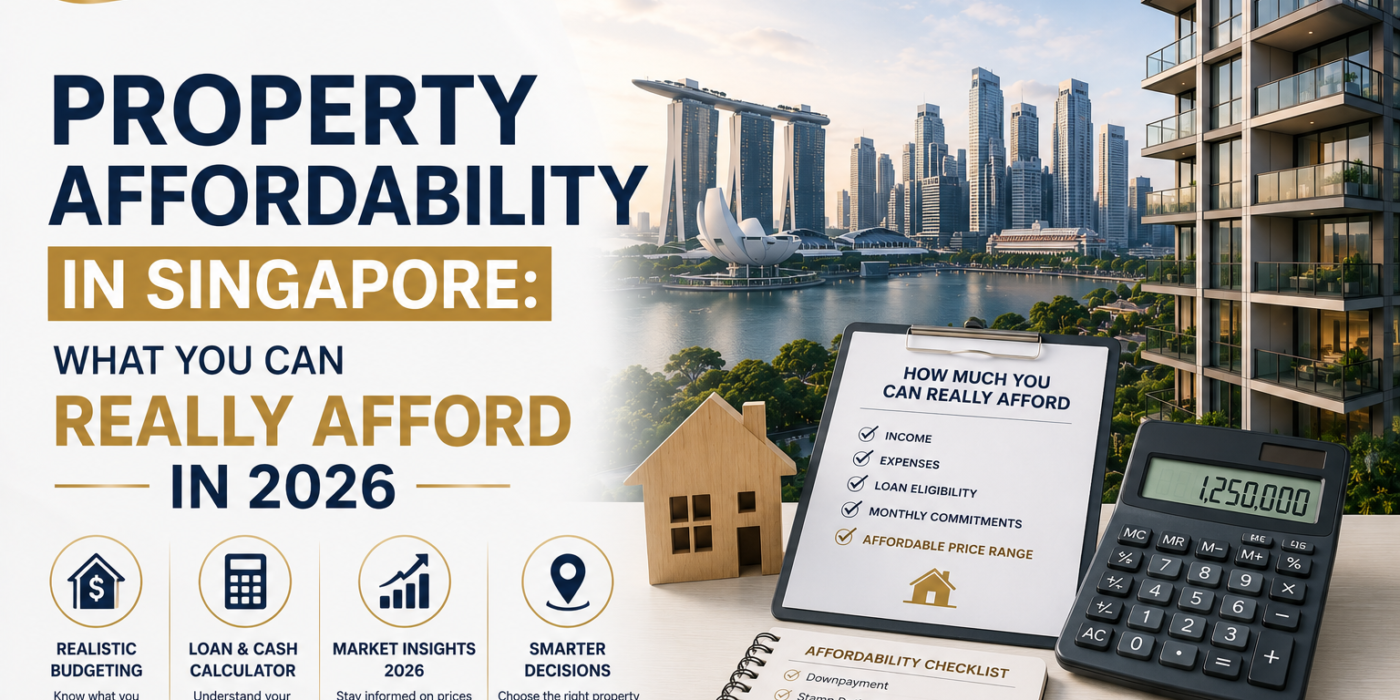
Advanced Heading

Frequently Asked Questions

Will Singapore property prices crash because of new Current and Future Supply and Demand of Housing?

Unlikely in the near term. The government actively manages GLS releases and adjusts cooling measures when needed, and structural demand from upgraders and new households provides a floor under prices.

It depends heavily on district. Central, land-scarce areas aren’t likely to get materially cheaper. OCR areas with heavier supply may offer more negotiating room.

Every new household needs somewhere to live. With around 20,000 forming annually, and the BTO income ceiling pushing some buyers into the private market, this is a steady and often underrated demand driver.

It shapes where new supply lands. Areas earmarked for rezoning, like the Greater Southern Waterfront or Paya Lebar, will see fresh residential stock over the next decade, which shifts the local supply-demand balance.

Yes, and it’s often missed. Collective sales replace older, lower-density developments with new, denser ones, adding units that don’t show up in official GLS supply figures.

The 60% ABSD rate for foreign buyers makes Singapore property expensive relative to other markets for non-residents. Over 98% of 2025 transactions came from citizens and PRs.

Typically three to four years from tender award to TOP. Supply announced this year won’t be move-in ready until closer to 2029 or 2030.

EC demand is strong, sales hit an eight-year high in Q1 2026, but supply of new EC sites is limited, so good units tend to sell quickly.

OCR districts near GLS Confirmed List sites, along with areas near new MRT lines like the Cross Island Line, are expected to see the bulk of new completions.

Lower rates make monthly repayments more manageable and tend to pull hesitant buyers back into the market faster than new supply alone can cool demand. Rate hikes have the opposite effect.