Property Decoupling in Singapore
Categoriesarticles

Property Decoupling in Singapore: Free Calculator + 2026 Guide

You’re here because you and your partner want to buy a second property, and you’re trying everything you can think of to dodge that ABSD bill.

Fair enough. It’s a fair chunk of change. And “decoupling” is the word that keeps coming up whenever you Google your way around it. Problem is, most people throwing that word around can’t actually explain what it involves, what it costs, or when it quietly backfires.

This guide (and the free calculator below) walks through all of it, including a 2026 court case that’s changed how Property Decoupling needs to be done properly.

TL;DR

  • Property Decoupling means one spouse sells their share of a jointly-owned private property to the other, so the seller becomes a “first-timer” again for their next purchase.
  • Only private property can be decoupled between married couples. HDB flats can’t, except for divorce, death, or a handful of other special cases.
  • Total decoupling costs (legal fees, BSD, possible SSD, CPF refund) commonly land between $20,000 and $150,000+, depending on property value and timing.
  • A 2025 High Court case, Jake v Millie, showed that a 99/1 ownership split doesn’t hold up if the money paid doesn’t match the paper ownership, and IRAS can now come after understamped deals.
  • Decoupling isn’t automatically the cheaper option. Run the numbers before assuming it beats just paying ABSD outright.
  • Download our free decoupling calculator to check your specific numbers before speaking to a lawyer or agent.

What Is Property Decoupling in Singapore, Actually?

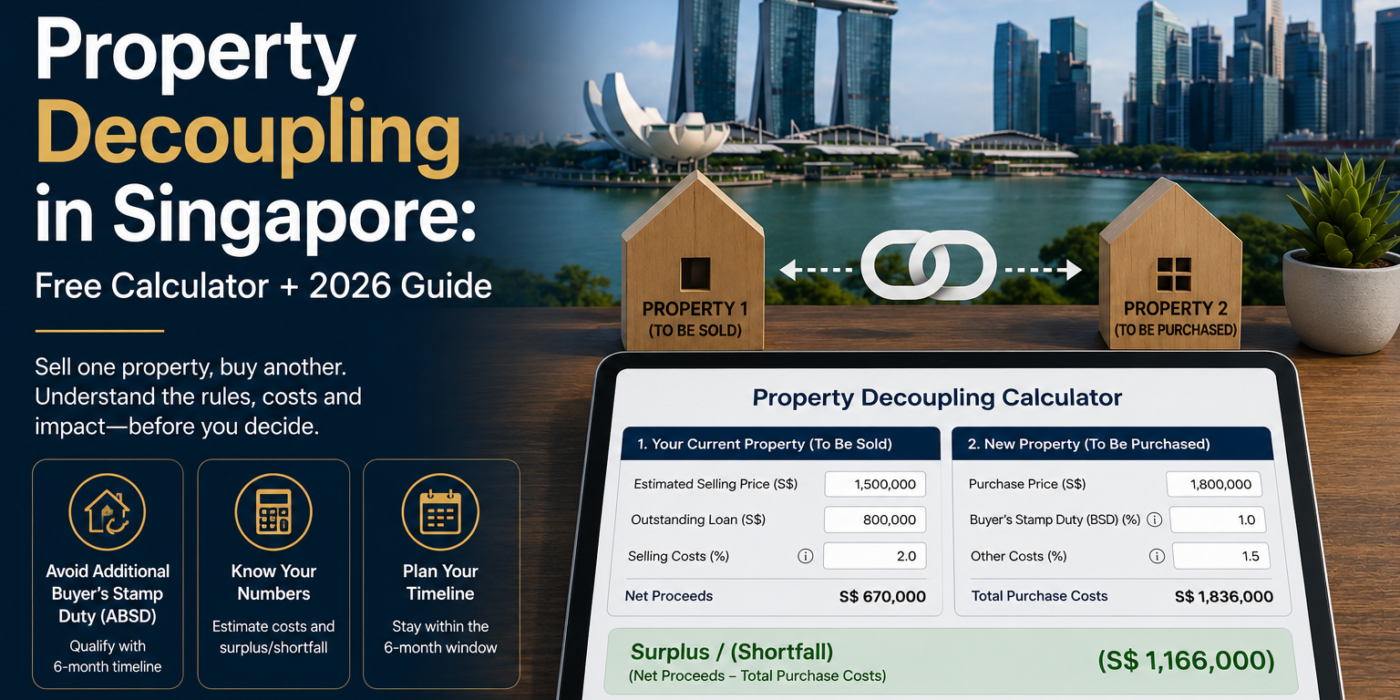
Strip away the jargon and decoupling just means one co-owner selling their share of a property to the other. The word itself comes from “decouple,” to separate one thing from another. In property terms, that’s separating joint ownership into sole ownership.

Practically, it works like this: you and your spouse currently hold a private property jointly, say 50/50, or maybe 99/1. One of you sells your share to the other. Paperwork goes through a lawyer, gets submitted to the Singapore Land Authority, and the title updates to reflect one owner instead of two. From that point, the mortgage sits with one person too.

Here’s the part people often assume wrongly: HDB flats work under completely different rules. Married couples cannot decouple an HDB flat. HDB tightened this in 2016 after spotting people abusing it, and now only allows ownership transfers under six specific situations, divorce, death of an owner, marriage, financial hardship, renunciation of citizenship, or medical reasons. If you’re picturing Property Decoupling your HDB to free yourself up for a second purchase, that door’s closed.

Why Everyone’s Suddenly Interested in Property Decoupling in Singapore

Simple. ABSD.

Additional Buyer’s Stamp Duty sits on top of the regular Buyer’s Stamp Duty every property buyer pays, and it’s calculated on whichever is higher, the purchase price or the valuation. It was introduced back in 2011 to cool down runaway demand, and the rates have only gotten steeper since.

Here’s where things stand currently:

Buyer Profile

1st Property

2nd Property

3rd+ Property

Singapore Citizen

0%

20%

30%

Singapore PR

5%

30%

35%

Foreigner

60%

60%

60%

Entity (company)

65%

65%

65%

So say you’re a Singapore Citizen couple buying a $1.5 million condo as your second property. That’s $300,000 in ABSD alone, on top of everything else. Suddenly the idea of restructuring ownership so one of you counts as a “first-time” buyer again looks pretty appealing.

That’s the entire logic behind Property Decoupling. Sell the shared property fully to one spouse, and the other spouse is now free to buy again without triggering the second-property ABSD rate.

What Property Decoupling In Singapore Actually Costs

If Property Decoupling In Singpaore saved money automatically, every couple in Singapore would already be doing it. It doesn’t, and that’s exactly why there’s a whole industry of advisors debating whether it makes sense case by case.

Cost Item

Typical Range

Notes

Legal fees (both sides)

$6,000 – $7,000

Buyer needs conveyancing, seller needs a separate lawyer for the transfer

Buyer’s Stamp Duty

Standard BSD rates apply

Payable by the spouse buying out the other’s share

Seller’s Stamp Duty

12% (Yr 1) / 8% (Yr 2) / 4% (Yr 3)

Only applies if decoupling within the first 3 years of purchase

Loan prepayment penalty

~1.5% of amount prepaid

Applies if repaying the loan early, check your bank’s terms

CPF refund

Principal + accrued interest

Must return CPF used, which can eat into available cash badly

Add it up on a $1 million property and decoupling expenses can realistically hit $150,000 or more, particularly if Seller’s Stamp Duty applies. Compare that against the ABSD you were trying to dodge, and sometimes decoupling ends up costing more than just paying the tax outright.

Two mistakes come up constantly here. First, people assume decoupling automatically beats ABSD, without actually running both numbers side by side. Second, people miscalculate their specific ABSD rate based on nationality and residency status, which is genuinely easy to get wrong and expensive when it happens. Get a professional to run the actual figures. This isn’t the place to eyeball it.

The Jake v Millie Case: Why 2025 Changed Everything

This is the part that most Property Decoupling guides still haven’t caught up on, and it matters a lot if you’re structuring a 99/1 ownership split.

In June 2025, a Singapore High Court case, referred to as Jake v Millie, involved a couple who’d structured their condo purchase as a 99/1 split, Millie on paper owning 99%, Jake owning 1%. The split existed to reassure Millie in the relationship, nothing more calculated than that on the surface. Except Jake had actually paid for the bulk of the property, far beyond his 1% paper share.

When the relationship ended, Millie pointed to the title deed. Jake pointed to his bank statements. The court sided with Jake, ruling that the paper split didn’t reflect who actually funded the purchase, and that Millie held a large chunk of the property “in trust” for him. Jake ended up recognised as owning over half the property, 54.22%, despite his name showing just 1% on paper.

But here’s the sting in the tail. The court also flagged that the couple’s plan to eventually decouple, and to pay stamp duty on only the 1% share, amounted to an illegal purpose under the Stamp Duties Act.

What This Actually Means for You

Three things fall out of this ruling that matter for anyone considering a 99/1 arrangement:

  1. The title deed isn’t the final word. Courts will look at who actually paid, not just whose name sits where. This is called a “resulting trust,” and it can override the paper split entirely.
  2. Decoupling a mismatched 99/1 can trigger understamping issues. If the 1% owner actually contributed, say, 40% of the purchase price, then stamping the eventual sale at only 1% value is under-declaring to IRAS, and that’s treated as a legal breach, not a technicality.
  3. The “ABSD loophole” is being watched. A 99/1 split isn’t illegal on its own, but if it’s clearly built to dodge ABSD with no other real purpose, IRAS can disregard the arrangement entirely and charge full ABSD plus a surcharge of up to 50%.

If You Already Own a 99/1 Property and Want to Decouple

For anyone already sitting in this exact situation, here’s the realistic path forward:

  1. Re-check your true ownership share first. Pull bank statements, CPF contribution records, and loan agreements to work out who actually funded what percentage, not what the title says.
  2. Stamp the true share, not the paper share. If your real contribution turns out to be 40%, not 1%, stamp duty on the eventual transfer needs to reflect that 40%, or you’re back in understamping territory.
  3. Know that the original purchase can still be reviewed. Fixing today’s stamping doesn’t erase IRAS’s ability to look back at the original transaction if it looks like it was structured purely for tax avoidance. There’s no time limit on that review.
  4. Consider getting IRAS adjudication upfront. Presenting your case to IRAS voluntarily, before decoupling, gives you certainty on the correct stamp duty owed and avoids the risk of a penalty landing later.

Document everything. Get independent legal advice specific to your situation. And go in accepting there’s some residual risk on the original purchase even after you’ve corrected the current one. This isn’t a DIY spreadsheet exercise anymore, not since 2025.

Decoupling vs Buying Under Trust: Which Fits Your Situation?

These two strategies get lumped together a lot, but they solve different problems.


Decoupling

Buying Under Trust

What it does

Frees one spouse to buy a 2nd property ABSD-free

Secures a property in a child’s name

Who ends up owning it

One spouse, fully

The child (as beneficiary)

Reversible?

No

No

Typical cost

$20,000 – $150,000+ depending on value and timing

65% ABSD upfront (refundable if remission approved) plus $10,000-$13,000 in legal fees

Best suited for

Couples who already jointly own a property and want to buy again

Parents planning ahead for a child’s first home

If you’re weighing this exact choice, it’s worth reading our full breakdown on buying property under trust in Singapore before deciding, since the right answer really depends on who you’re trying to benefit, your spouse or your child.

The Step-by-Step Property Decoupling in Singapore Process

Broadly, here’s how it plays out from start to finish:

  1. Get your property valued by a bank or licensed valuer to establish the current market price.
  2. Check loan eligibility for the spouse buying out the other’s share, since they’ll need to qualify for the full mortgage solo.
  3. Engage two separate lawyers, one representing the buying spouse, one representing the selling spouse.
  4. Calculate and settle CPF refunds for the selling spouse, principal plus accrued interest.
  5. Pay Buyer’s Stamp Duty on the transferred share (and Seller’s Stamp Duty if within the 3-year window).
  6. Submit the transfer instrument to the Singapore Land Authority to update the title.
  7. Confirm the new sole owner can proceed to purchase the next property without the second-property ABSD rate applying.

Each step has its own timing quirks, and getting the sequence wrong (especially around the loan refinancing and CPF refund) is where most delays happen.

When Decoupling Isn’t Actually Worth It

A few situations where the maths just doesn’t work in decoupling’s favour:

  • Your second property is significantly cheaper than your first. The ABSD saved may not cover the decoupling costs at all.
  • You’re still within the first 3 years of ownership, meaning Seller’s Stamp Duty applies on top of everything else.
  • Your CPF usage on the original property is large, since the refund requirement can leave you with far less cash than expected.
  • You own multiple properties already, where the maths tends to get complicated fast and often doesn’t favour decoupling at all.
  • Your ownership split doesn’t match who actually paid, given what the Jake v Millie ruling now means for understamping risk.

Run Your Own Numbers First

Decoupling isn’t a strategy you should back into just because the word keeps showing up in Facebook groups and Google searches. Sometimes it saves a genuine six figures. Other times it costs more than the ABSD it was meant to dodge.

Download our free Decoupling Calculator to check your own numbers first. You’ll need your property’s current valuation, your age and income (from your Notice of Assessment, to estimate loan eligibility), your CPF OA balance and amount used, and how long you’ve owned the property.

Given how much the 2025 ruling has changed the risk profile around 99/1 splits, this really isn’t something to work out alone on a spreadsheet anymore. Our property consultation walks through your specific numbers, ownership structure, and whether decoupling actually beats the alternatives for your situation. If you’re thinking about this as part of a bigger, multi-property strategy, it’s worth speaking with a Singapore property investment advisor before committing to anything irreversible.

For more on where the law currently stands, read our breakdown of IRAS’s stance on decoupling and the 4-point plan that follows the Jake v Millie ruling, and our separate piece comparing the 99/1 strategy against decoupling directly.

At SG Luxury Condo, we’ve run these calculations for enough couples to know that “everyone’s doing it” isn’t a good enough reason to decouple. If you’re browsing luxury condos for sale in Singapore and trying to work out the smartest way to structure your next purchase, we’re happy to run the actual numbers with you before you commit to anything.

Advanced Heading

Frequently Asked Questions

Is Property Decoupling always cheaper than paying ABSD?

No. On a $1 million property, decoupling costs can realistically hit $150,000 or more once legal fees, stamp duties, and CPF refunds are added up. Compare that against your actual ABSD bill before assuming decoupling wins.

No. Married couples cannot decouple HDB flats. It’s only permitted under six special cases, marriage, divorce, death of an owner, financial hardship, renunciation of citizenship, or medical reasons.

A Singapore High Court case in 2025 ruled that a 99/1 paper ownership split didn’t reflect true ownership, since one party had actually funded far more than 1% of the property. The court also flagged the couple’s decoupling plan as involving an illegal understamping arrangement.

If your actual financial contribution doesn’t match the paper split, yes, it’s worth reviewing. Getting professional advice, and possibly IRAS adjudication, before decoupling is now the safer path.

Typically $6,000 to $7,000 combined, since both the buying and selling spouse need separate lawyers to handle the transfer correctly.

Yes, if the transfer happens within the first 3 years of the original purchase. Rates run 12% in year one, 8% in year two, and 4% in year three.

Decoupling shifts full ownership to one spouse so they can buy a second property ABSD-free. Buying under trust secures a property for a child. They solve different problems and aren’t interchangeable strategies.

It depends on residency and marital structure, and the numbers usually work out differently than for citizen couples. This is a case where speaking to a professional before assuming anything is genuinely worth the fee.

Yes. The transfer instrument goes through the Singapore Land Authority and stamp duty is assessed by IRAS directly. There’s no version of decoupling that happens off IRAS’s radar.

Yes, it’s a smart first step. A calculator gives you a rough sense of whether decoupling makes financial sense at all before you spend on legal fees to formalise anything.
Freehold vs Leasehold Properties in Singapore
Categoriesarticles

Freehold vs Leasehold Properties in Singapore: Which One Actually Wins?

A lot of Singaporean buyers won’t even look at a 99-year leasehold unit. Freehold or nothing, full stop, like leasehold is some kind of consolation prize.

Here’s the thing though. We went and pulled the actual price data, and it tells a very different story than the one most people repeat at dinner parties.

TL;DR

  • Freehold properties typically cost 15-20% more than comparable leasehold units, mostly because the government stopped selling freehold land ages ago.
  • Higher price doesn’t mean higher returns. In several long-run comparisons, 99-year leasehold condos actually outgrew freehold ones.
  • Rental yield tends to favour leasehold, since your rental income stays the same while your entry price is lower.
  • Lease value barely erodes in the first 10-15 years. The steep decay only kicks in from around the 40-year mark onward.
  • Freehold still wins for legacy planning and long holding periods past 15 years, plus certain foreign buyer segments lean freehold too.
  • If you’re holding for under 12 years, the data leans leasehold. Past 15 years, freehold starts to make more sense.

The Six Things That Actually Separate Freehold and Leasehold


Buying a home comes with a dozen decisions stacked on top of each other, and tenure is one that gets debated way more than it probably should. So let’s actually break it down, properly, across the six areas that matter:

  1. Time limit on ownership
  2. Cost and long-term value
  3. Rental yield
  4. En bloc potential
  5. Loan and CPF restrictions
  6. Legacy planning

Freehold vs Leasehold: The Time Limit

Freehold-condo-sold-en-bloc

Freehold means exactly what it sounds like. Free from hold. You own the unit and the land under it, with no expiry date attached.

That said, “no expiry” doesn’t mean untouchable. The Singapore Land Acquisition Act, in place since 1966, lets the government reclaim your land for public projects like MRT lines, roads, or bridges. And if a developer wants your freehold building for a fresh redevelopment, an en bloc sale can still go through, provided enough of your neighbours agree to it. Casa Sophia, a freehold development, sold en bloc for $29 million, so freehold doesn’t put you outside that process at all.

Leasehold works differently. You own the unit for a set number of years, usually 99 in Singapore, occasionally 999 (a legacy structure that was more common decades ago and isn’t really used for new projects anymore).

Freehold vs Leasehold: Cost and Real Value

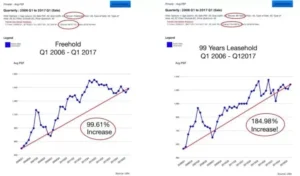
Freehold-vs-99LH-Growth

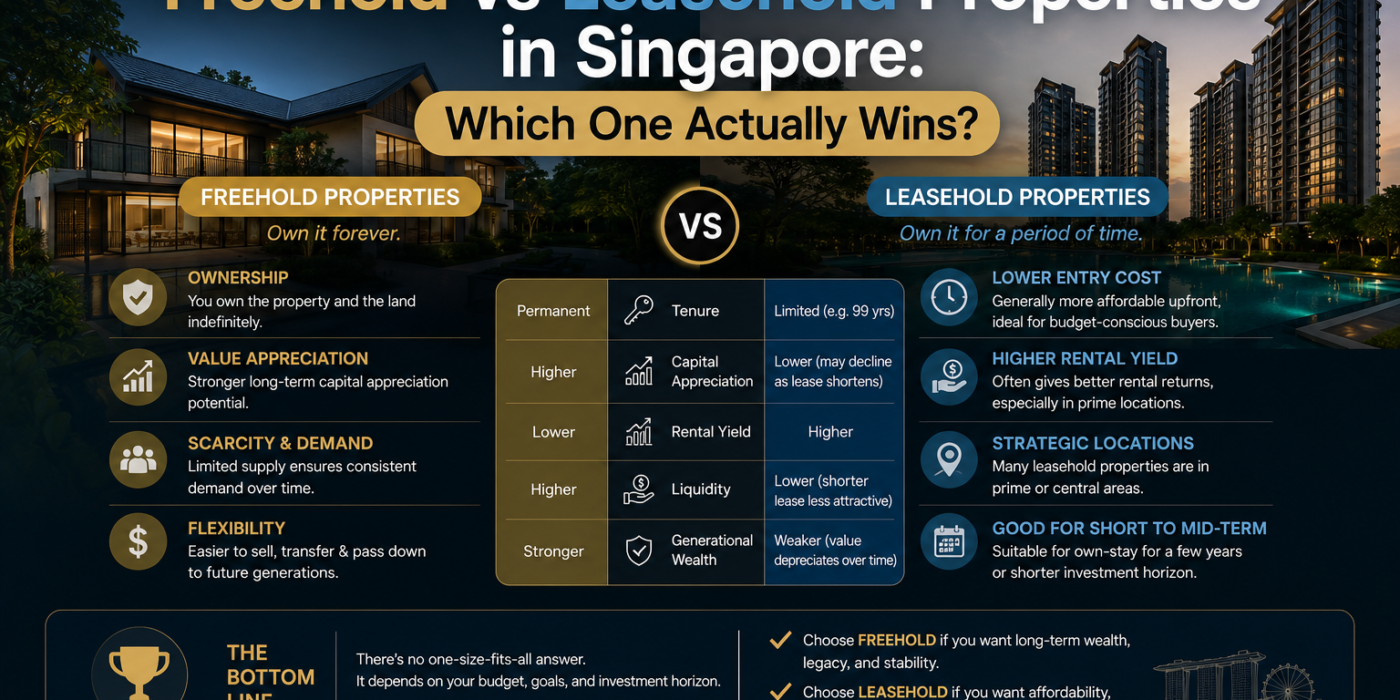
Freehold units generally run 15-20% pricier than equivalent leasehold ones. Simple supply issue really, the government stopped releasing freehold land a long time back, so what’s left is scarce, and scarce things cost more.

Here’s where most people get it wrong though: paying more doesn’t automatically mean the property is worth more, or that it’ll appreciate faster.

Location matters far more than tenure in most cases. An 80-year leasehold unit in a great district will usually out-value a freehold unit stuck in a quiet, out-of-the-way corner of Singapore. And when a freehold property happens to sit next to an MRT station with strong connectivity, good luck figuring out how much of that premium is actually the freehold status versus just the location.

The data backs this up pretty clearly. Comparing average psf values of freehold versus 99-year leasehold properties from Q1 2006 to Q1 2017, both climbed, but leasehold rose 184.98% against freehold’s 99.61%. Roughly double.

Look at Scotts Square (freehold) next to The Orchard Residences (99-year leasehold) between 2007 and 2018. Orchard Residences gained 4%. Scotts Square actually dropped 17%.

Zoom out to a broader look at freehold versus leasehold private condos from 2010 to 2021, and leasehold appreciated 48.1% against freehold’s 29.74%.

Case Study: Stars at Kovan vs Tembusu

Two condos, launched around the same time, both a five-minute walk from Kovan MRT, similar unit counts. About as clean a comparison as you’ll find.


Stars @ Kovan (99-Year Leasehold)

Tembusu (Freehold)

2016 launch price

~$1,400 psf

~$1,500 psf

Price growth (shorter holding period)

17%

3%

That’s roughly a 5x difference in growth. If you’re holding over a shorter period, the data here is not subtle.

The same pattern shows up regionally too. Both the Rest of Central Region (RCR) and Outside Central Region (OCR) show leasehold outperforming freehold over comparable stretches.

But Freehold Does Win Sometimes

None of this means freehold never outperforms. Comparing freehold Leedon Residence against its leasehold neighbour D’Leedon (literally across the road from each other) from 2009 to 2020, Leedon Residence appreciated 12.86% versus D’Leedon’s 7.2%.

So tenure alone doesn’t decide the outcome. What actually seems to matter is timing, relative to how much lease decay has already happened.

Lease value barely moves in the first 10-15 years of ownership. A leasehold condo behaves almost identically to a freehold one during that window. The real drop-off starts showing up from around the 40-year mark, which is when the discount against freehold value widens sharply.

Put together: freehold costs more upfront, but that higher entry price doesn’t reliably translate into higher returns, particularly in the earlier decades of a lease.

Freehold vs Leasehold: Rental Yield

Rental yield is annual rent divided by what you paid. Lower entry cost, higher yield, assuming rent stays roughly the same.

And rent basically does stay the same. Tenants don’t pay less because your unit sits on a 99-year lease, and they won’t pay more just because yours happens to be freehold. Nobody asks about tenure before signing a lease.

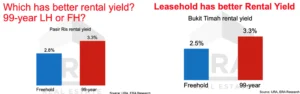
Freehold-vs-Leasehold-Rental-Yield

So here’s the math. A $1,000,000 leasehold unit renting for $3,000 a month gives you a 3.6% yield. A freehold unit in the same area, priced 15% higher at $1,150,000, renting for the same $3,000, gives you 3.1%.

Real examples back this up. In Pasir Ris, freehold rental yield sits at 2.8% against 3.3% for 99-year leasehold. Bukit Timah shows the same pattern.

Makes sense once you think about it. Leasehold’s higher yield is basically compensation for owning a depreciating asset. You’re getting paid a bit more, in cash flow, for taking on the shorter runway.

Freehold vs Leasehold: En Bloc Potential

The common assumption is that freehold en bloc payouts should be bigger, since freehold owners are technically giving up more. Makes sense on paper.

Reality is messier. Zoning restrictions can cap what a developer’s allowed to rebuild, regardless of tenure, which drags the offer down even for freehold sites. Nearby infrastructure, upcoming MRT lines, new schools, retail, plays into a developer’s offer too. A freehold building surrounded by ageing, unimproved amenities can still get a mediocre bid.

Farrer Court, a 99-year leasehold development, sold en bloc in 2007 for $1.34 billion, still one of the largest collective sale prices on record, with residents walking away with over $2 million each.

Statistically, tenure doesn’t even show up as a significant predictor of en bloc success at the 5% level, though it does carry a large economic effect when a sale does go through. Translation: tenure influences the size of the payout somewhat, but it’s not the deciding factor in whether an en bloc succeeds at all.

Freehold vs Leasehold: Loan and CPF Restrictions

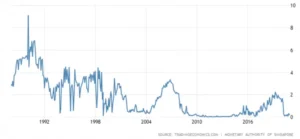
Singapore-Interest-Rate

This is where leasehold quietly gets harder, and it’s easy to miss until you’re deep into financing.

If the remaining lease won’t outlast you until age 95, banks and HDB will cap your loan quantum below the usual maximum. Fall under a 20-year remaining lease, and CPF usage gets shut off entirely for that purchase.

CPF has its own rule on top: the buyer’s age plus the remaining lease needs to add up to at least 80 years. Leases sitting between 30 and 60 years remaining trigger a valuation limit on how much CPF you’re allowed to put toward the purchase.

Net effect, older leasehold units, particularly ones past the 40-year mark, end up with a smaller pool of financially qualified buyers, which drags resale prices down further. It’s part of why lease decay accelerates the way it does later in a lease’s life, fewer buyers can actually finance the purchase, not just that the asset is “worth less.”

What Happens When a 99-Year Lease Actually Runs Out?

This is the question that scares people the most, and honestly, most Singaporeans have never seen it play out because so few private leasehold developments have actually hit zero years yet.

Technically, when the lease expires, ownership reverts to the state and the land goes back to SLA (Singapore Land Authority) with no compensation owed to owners. That’s the textbook answer.

In practice, it rarely gets there. Most 99-year leasehold developments get identified for en bloc redevelopment or, in HDB’s case, are addressed through schemes like SERS long before the lease actually hits zero, precisely because an ageing, unsellable building with no CPF-eligible buyers left becomes a headache nobody wants to manage. That said, SERS is selective and not guaranteed, and plenty of older private leasehold estates simply ride out the decline in value with no redevelopment plan at all.

The realistic risk isn’t “the government seizes my flat overnight.” It’s a slower squeeze: shrinking loan eligibility, a thinner buyer pool, and declining resale value as the lease clock runs down, well before it ever reaches zero.

999-Year Leasehold vs Freehold: Is There Actually a Difference?

Barely, in practical terms. A 999-year lease is so long that no buyer, bank, or CPF rule treats it any differently from freehold. You won’t hit loan restrictions, CPF caps, or lease decay concerns within any realistic holding period.

The catch is supply. Very few 999-year leasehold developments exist today, since this tenure structure was mostly used decades ago and isn’t something the government issues for new land parcels anymore. If you do come across one, it behaves like freehold in every meaningful sense, just occasionally priced a touch below true freehold due to the label alone rather than any real legal difference.

Freehold vs Leasehold: Legacy Planning

person-holding-book-with-calculator-on-table

If the plan is to hold a property for decades and eventually pass it to your kids or grandkids, freehold is the stronger pick, hands down. That’s precisely why older buyers tend to gravitate toward it, they’re thinking multi-generational, not just next decade.

Certain foreign buyer groups lean freehold too. Between January 2016 and August 2017, leasehold accounted for 71% of all transactions against 29% freehold overall. But that split shifts a lot depending on nationality: 40% of Indonesian buyers went freehold, 41% of American buyers, 50% of both British and Australian buyers, and 34% of Hong Kong buyers. Company purchases skewed freehold even harder, at 60%. Worth noting too that foreign buyers concentrate heavily in Districts 9, 10, and 11, which is exactly where I’d point buyers toward freehold over leasehold if that’s the profile you fit.

Freehold vs Leasehold: Quick Decision Table

Your Situation

Better Fit

Holding under 12 years, chasing capital growth

Leasehold

Prioritising rental yield

Leasehold

Holding 15+ years, passing to family

Freehold

Foreign buyer in D9, D10, or D11

Freehold often preferred

Tight loan/CPF budget, buying an older unit

Check remaining lease carefully either way

So, Which One Should You Actually Buy?

If you’re chasing capital growth or rental yield over a holding period under 12 years, the numbers point pretty clearly toward leasehold. If you’re planning to hold past 15 years, especially with legacy planning in mind, freehold earns its premium.

Tenure is one input though, not the whole decision. Entry price, the specific development’s characteristics, remaining lease at time of purchase, and your own exit timeline all matter just as much, sometimes more.

If you’re weighing a specific freehold or leasehold unit and want the actual numbers run for your situation, our property consultation walks through entry price, expected holding period, and financing eligibility together. For a longer-term view, especially if legacy planning is part of your thinking, it’s worth speaking with a Singapore property investment advisor before you commit either way.

If you’re still comparing which type of unit suits your goals, our guide on which condo is good for investment and our look at Singapore’s luxury homes market both build on a lot of what’s covered here.

At SG Luxury Condo, we’ve watched enough of these comparisons play out in real transactions to know that “freehold is always better” is one of the more expensive myths a buyer can walk in believing. If you’re browsing luxury condos for sale in Singapore and want a clear-eyed read on tenure before you commit, we’re glad to run the numbers with you.

Advanced Heading

Frequently Asked Questions

Are 1 bedroom properties in Singapore a good investment?

For rental yield, generally yes, the data consistently shows 1 bedroom units outperforming larger configurations. For capital appreciation and ease of resale, 2 and 3 bedroom units in RCR or OCR often do better. It depends on which outcome matters more to you.

Based on our analysis, most 1 bedroom units land between 3.3% and 4.6% gross yield, noticeably above the market average of 2% to 3% for private residential property overall.

CCR gives you stronger rental demand from expats, but OCR has historically shown better profitability on resale, mainly because entry prices are lower and leave more room for percentage gains.

Not necessarily. Our data shows units held 3 to 5 years actually outperformed those held over 5 years. Entry price and market timing matter more than simply holding longer.

Leasehold, based on the numbers. 99-year leasehold one-bedroom units showed a higher rate of profitable transactions than freehold ones, even after accounting for lease decay.

Generally yes. The buyer pool is smaller since most resale demand comes from HDB upgraders and families looking for more space, not less. Rental demand is strong, but resale demand is narrower.

It varies widely by district. OCR one-bedroom units can often be found under $750,000, while CCR one-bedroom units typically start well above that, sometimes crossing $1 million in prime addresses.

Mostly single expat professionals, young couples, and corporate short-term tenants near business hubs. Some student demand exists too, though it’s more price-sensitive.

Rarely as their own home, since most upgraders want more space for family. As an investment property held separately, though, a 1 bedroom unit can make sense for the yield alone.

Assuming high rental yield automatically means a good overall investment. It doesn’t account for resale difficulty, holding period risk, or the premium some buyers overpay for a prime address that the data doesn’t actually reward.

Interest Rate Impact on Singapore Property Prices
Categoriesarticles

Interest Rate Impact on Singapore Property Prices

Ask most people how interest rate impact on Singapore property prices and you’ll get the same answer every time. Rates go up, prices come down. Rates go down, prices climb. Clean, simple, done.

Except that’s not what actually happened here. We went digging through 21 years of price data to see if this “obvious” relationship holds up, and honestly, it doesn’t hold up nearly as well as people assume. The link between interest rates and Singapore property prices is a lot messier once you actually look at the numbers instead of the theory.

TL;DR

  • Interest Rate Impact on Singapore Property Prices isn’t as direct as most people think. Prices have risen during several periods when rates were climbing too.
  • Transaction volume tracks interest rates far more reliably than price does. Cheap borrowing brings more buyers and sellers into the market, not necessarily higher prices.
  • SORA is sitting around 1.0-1.2% as of mid 2026, down sharply from over 3.5% back in 2023. Fixed mortgage packages now start from roughly 1.40%.
  • Land supply, immigration policy, and cooling measures like TDSR and ABSD do more to shape Singapore property prices than interest rate movements ever have.
  • A 1% swing in your mortgage rate on a $1 million loan adds up to about $480 extra a month, or close to $144,000 over 25 years.
  • Most analysts are expecting 2-5% growth in private home prices for 2026, helped by cheaper mortgages rather than caused by them.

How Interest Rate Impact on Singapore Property Prices Are Actually Connected

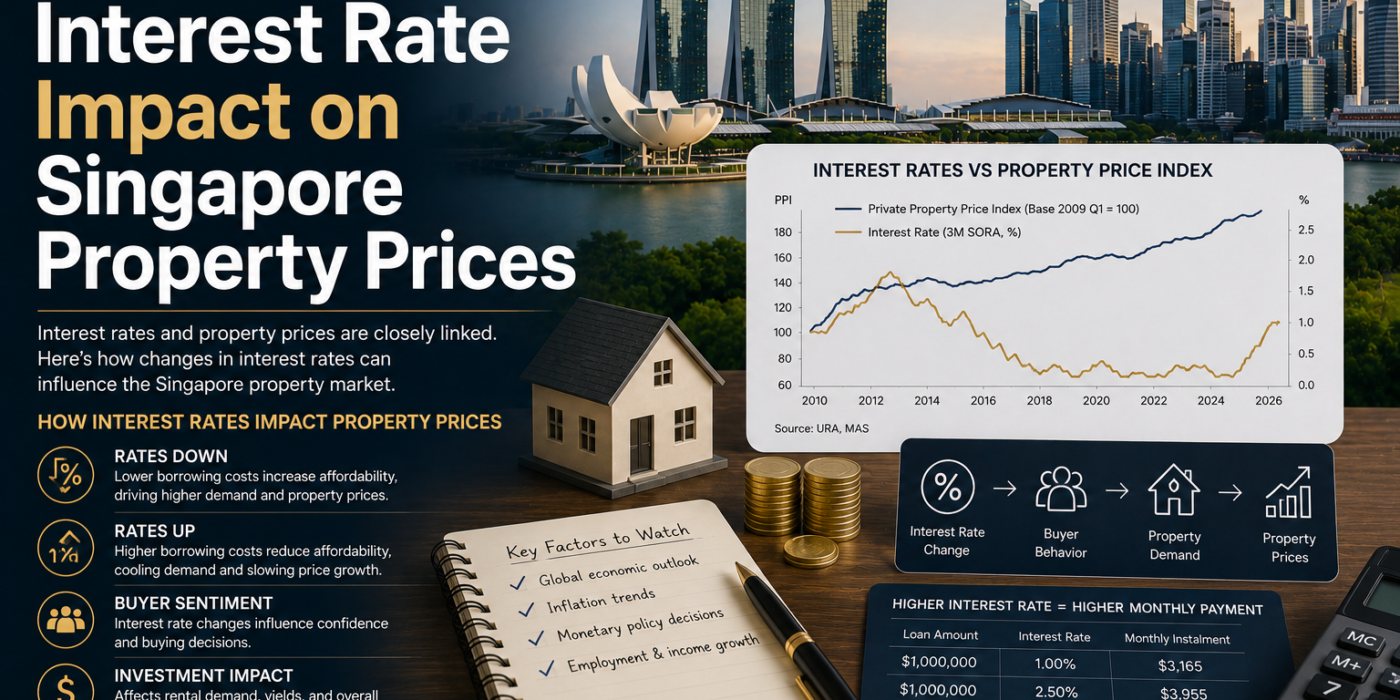
PPI-vs-Mortgate

Interest rates touch three things directly. What it costs you to borrow. How property compares to other places you could park your money. And how confident buyers feel about committing to a loan they’ll be paying off for the next 25 years.

Drop mortgage rates, and monthly repayments drop too. More people qualify for bigger loans, and a chunk of buyers who’d been dragging their feet suddenly decide it’s time to act. That’s the affordability piece, and it’s genuinely real.

Push rates up, and the theory says the opposite should happen. Borrowing costs more, some buyers get squeezed out, demand cools. Fair enough, that logic works fine on paper.

But here’s the thing. Singapore’s actual price history over the past two decades doesn’t play along with that story nearly as much as you’d expect.

What Actually Drives Singapore’s Mortgage Rates: SORA Explained

Before we go further, it’s worth understanding what’s really pulling your mortgage rate around, because it isn’t some local central bank setting a policy rate the way the Fed or the Bank of England does.

The Monetary Authority of Singapore (MAS) doesn’t set interest rates directly at all. Instead, it manages the Singapore Dollar against a basket of currencies, known as S$NEER, to keep inflation under control. That means Singapore’s interest rates are mostly imported from overseas, shaped by global markets and, more than anything else, by what the US Federal Reserve is doing.

Most floating-rate home loans here are pegged to SORA, short for Singapore Overnight Rate Average. It’s the benchmark that took over from SIBOR a few years back. Banks then add their own margin on top, usually up to around 1%.

So when the Fed moves, SORA tends to follow within a few months. And once SORA moves, your mortgage rate isn’t far behind.

Singapore Mortgage Rates in 2026: Where Things Actually Stand

Here’s where things sit right now, and it’s a very different world compared to 2023.

Metric

2023 Peak

Mid 2026

3-Month Compounded SORA

Above 3.5%

Roughly 1.0-1.2%

2-Year Fixed Home Loan

Around 3.10%

From approximately 1.40%

Floating Rate (SORA + spread)

Above 4.0%

Roughly 1.05-1.55%

HDB Concessionary Rate

2.6%

2.6% (unchanged)

Three-month SORA dropped from around 3% at the start of 2025 down to roughly 1.2% by year end, and it’s basically held steady near that level heading into 2026. Bank economists mostly expect it to stay somewhere between 0.7% and 1.2% for the rest of the year, though there’s some chance of a small bump up if inflation surprises on the upside.

That’s a big shift if you’re financing a home now versus someone who locked in a rate two or three years ago.

Fixed vs Floating: Which Makes Sense in This Rate Environment

This question comes up in almost every conversation we have with buyers right now, and there’s no single right answer. It really comes down to how long you plan to hold the property.


Fixed Rate

Floating Rate

Best for

Buyers who want payment certainty

Buyers who expect rates to fall further or plan to sell within 2 years

Current range (2026)

~1.40-1.80%

~1.05-1.55%

Risk

You may miss out if rates drop further

Payments rise if SORA climbs back up

Typical lock-in

2-3 years

Reprices quarterly (3M SORA)

The gap between fixed and floating rates is tighter than it’s been in years, sometimes as little as 0.15-0.40%. Because of that narrow spread, a good number of buyers are just picking fixed for the peace of mind, even knowing floating might save them slightly more if SORA keeps sliding.

How a 1% Rate Change Hits Your Monthly Mortgage

Percentages don’t mean much until you see them as real dollars. So here’s what a 1% shift actually looks like on a $1,000,000 loan spread over 25 years.

Interest Rate

Approx. Monthly Payment

Total Interest Over 25 Years

1.5%

~$4,000

~$200,000

2.5%

~$4,480

~$344,000

3.5%

~$5,000

~$500,000

One percentage point on a $1 million loan works out to roughly $480 more (or less) every month, and close to $144,000 across the full loan tenure. That’s really why interest rates get so much attention in the first place, even when their actual pull on the sale price is far weaker than people assume. Want to see your own numbers? Run them through our mortgage affordability calculator before you sign anything.

The 5 Ways Interest Rates Actually Move the Market

Interest rates ripple through the property market in a few different ways, and they don’t all pull in the same direction at the same time.

  • Mortgage affordability. Lower rates shrink monthly repayments, which pulls more buyers into the market and usually bumps up transaction activity.
  • Investor behaviour. When bonds and savings accounts barely pay anything, property starts looking like the better option, so money flows that way. Raise rates, and that comparison flips.
  • Housing market activity. Cheaper financing speeds up decisions. That family who’d been “thinking about upgrading” for two years finally pulls the trigger.
  • Speculation. Cheap money used to fuel quick flips. These days, Singapore’s Seller’s Stamp Duty (SSD) has mostly shut that door, regardless of where rates land.
  • Broader economic conditions. Rates usually climb when the economy’s strong and fall when it needs a boost. That underlying backdrop often matters more than the rate number itself.

21 Years of Data: Interest Rates vs Property Prices in Singapore

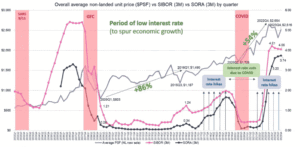
Here’s where the neat little theory falls apart. Line up Singapore’s Property Price Index against interest rates from 2002 to 2023, and the pattern is inconsistent, to put it mildly.

Period

Interest Rate Trend

Property Price Trend

2004-2006

Rising

Rising

2007

Peaked near 6%

Prices hit an all-time high by Q1 2008

2008

Falling sharply

Falling

2009-2016

Low

Rose roughly 86% over the period

2017-2019

Rising

Rising

2019-2020

Falling

Rising

2020-2021

Low

Rising

2022-2023

Rising sharply

Still rising

Three out of these eight periods show rates and prices climbing together, not moving apart like they’re supposed to. If interest rates alone controlled Singapore property prices, that shouldn’t be possible.

Interest Rate vs Transaction Volume: The Correlation That Actually Holds

 PPI-vs-Transaction-Volume

Where interest rates actually do show a consistent pattern is with transaction volume, not with price.

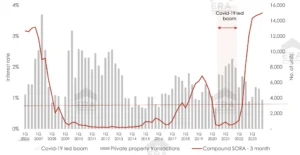
Fourteen straight years of low rates, from 2008 to 2022, lined up with strong buying and selling activity for most of that stretch. When rates go up, people don’t usually accept lower prices for their homes. They just take longer to find a buyer, and fewer deals close overall.

That distinction matters if you’re trying to time a purchase or sale around rate movements. A high-rate period usually means a quieter market, not a cheaper one.

The 3 Things That Actually Move Singapore Property Prices

Based on the data, interest rates are just one piece of the puzzle, and probably not even the biggest one. The Singapore government holds three levers that carry more weight:

  1. Land supply, through Government Land Sales (GLS), which decides how many new units hit the market each year.
  2. Immigration policy, since Singapore’s population is targeted to grow from roughly 5.5 million toward 6.9 million by 2030, with more Permanent Residents adding to housing demand along the way.
  3. Cooling measures, including Additional Buyer’s Stamp Duty (ABSD), Total Debt Servicing Ratio (TDSR), and Loan-to-Value (LTV) limits, which throttle demand directly no matter what interest rates are doing.

Land here is genuinely scarce and tightly controlled, so these three factors tend to outweigh rate movements when it comes to actually deciding where prices go.

2026-2027 Price Outlook: Three Scenarios

Nobody’s got a crystal ball on this one, so scenarios make more sense than pretending we can nail down a single number.

Scenario

Interest Rate Path

Likely Price Impact

Bull case

Fed cuts more aggressively, SORA drops further

Prices could rise 5-8% over 2026-2027, led by OCR and RCR

Base case

SORA stabilises near current levels through 2026

Most agencies forecast 2-5% growth for 2026

Bear case

Inflation surprises push rates back up

Price growth moderates further, transaction volume slows

Most of the big property consultancies are sitting in the base case camp right now, forecasting private home prices to rise somewhere in the low to mid single digits for 2026. That’s being driven by steady owner-occupier demand and better affordability, not some aggressive rate-cutting cycle.

What This Means If You’re Buying, Selling, or Refinancing Right Now

  • Buyers: stress-test your budget against rates 1-2% higher than today’s offer, not just today’s rate. Fixed lock-ins run out eventually, and floating rates move.
  • Existing homeowners: if your current package sits noticeably above the roughly 1.40-1.95% range on offer now, refinancing could save you thousands a year.
  • Sellers: a lower rate environment usually pulls more buyers in and shortens how long your listing sits, even if it doesn’t push your final price up.
  • Investors: weigh rental yield against your total financing cost carefully. Cheaper mortgages help your cash flow, but yield compression is a real risk if new supply floods in.

Making Sense of It Before You Commit

Interest rates matter, sure, but they’re not the whole picture. Treating them as the single factor behind a buy or sell decision is where a lot of people go wrong. Land supply, population growth, and cooling measures have shaped Singapore property prices far more consistently over the past twenty years than interest rates ever have.

Trying to figure out if now’s the right time to buy given where rates sit? Our property consultation walks through your actual numbers, financing options, and timing, not generic advice. And if you want a longer-term view that factors in GLS supply, population trends, and where cooling measures might head next, it’s worth talking to a Singapore property investment advisor before you commit either way.

For more context on where the broader market stands, check out our breakdown of the major impacts on Singapore’s property market and our take on whether property prices will drop. Both pair well with what we’ve covered here.

At SG Luxury Condo, we keep a close eye on SORA, GLS tenders, and cooling measures, not because rates are the whole story, but because understanding how all three levers work together is what actually helps you time a purchase right. Browsing luxury condos for sale in Singapore and want a clearer read on where things stand today? We’re happy to walk through it with you.

Advanced Heading

Frequently Asked Questions

Do lower interest rates always push Singapore property prices up?

Not always, and the 21-year data makes that pretty clear. Prices rose during several stretches of rising rates too. Interest rates are one factor among many, not the deciding one.

SORA, or the Singapore Overnight Rate Average, is the benchmark most floating-rate home loans are pegged to. When it moves, your monthly repayment moves with it if you’re on a floating package.

Depends on how long you’re planning to hold the loan. Fixed rates give you certainty and currently sit close to floating rates, so they’re appealing if predictability matters to you. Floating works better if you expect rates to keep falling, or you plan to sell within a year or two.

On a $1,000,000 loan over 25 years, about $480 a month, or nearly $144,000 across the full tenure. That’s a real number, even if the property’s sale price barely moves.

Strong owner-occupier demand, tight new supply, and steady population growth outweighed the higher cost of borrowing during that stretch. It’s a solid example of why interest rates alone don’t decide where prices go.

Not necessarily. It often means less competition and more room to negotiate, since fewer transactions tend to happen when rates are high, even if prices themselves hold steady.

Land supply through Government Land Sales, immigration and population growth, and cooling measures like ABSD and TDSR. These three levers, all controlled by the government, have a far more consistent track record of moving prices than interest rates do.

If your current rate is sitting well above the 1.40-1.95% range being offered now, it’s worth comparing packages. Even a small drop can add up to real savings over a 25-year tenure.

Not automatically, based on what the historical data shows. Prices have climbed through rising-rate periods before. A rate hike is more likely to slow down transaction volume than to push prices lower.

Stress-test your monthly budget assuming rates run 1-2% higher than today’s offer. If you can still comfortably cover the loan at that higher rate, you’ve got a reasonable cushion against whatever comes next.

1 Bedroom Properties in Singapore
Categoriesarticles

1 Bedroom Properties in Singapore: What the Data Actually Shows

Every new launch in Singapore seems to sell out its one-bedroom units first. Midtown Modern moved 90% of its one- and two-bedroom stock on launch weekend. One North Eden cleared 85% of its units, with one-bedroom-plus-study taking the lead, gone by 10am on day one.

So the question isn’t whether people want them. It’s whether they should.

This is one of the most common questions we get asked directly, usually right before someone’s about to sign an OTP. So we pulled the actual transaction data and ran the numbers ourselves, instead of just repeating what everyone assumes.

Midtown-suites-Bugis

TL;DR

  • 1 bedroom properties in Singapore consistently post the highest rental yields of any unit type, but that doesn’t automatically make them the best investment.
  • Central districts (CCR) are the worst-performing for profitability, despite being the most sought-after for rental. Outside Central Region (OCR) wins on capital appreciation.
  • Longer holding periods don’t guarantee better returns for 1 bedroom units. Units held 3-5 years actually outperformed those held over 5 years.
  • Leasehold 1 bedroom units beat freehold ones on profitability, even after factoring in lease decay.
  • 1 bedroom units are easier to rent, harder to sell. Know which goal matters more to you before you commit.
  • Quantum and rental yield matter more than bedroom count on its own. Run the numbers on the specific unit, not the label.

Should You Focus on 1 Bedroom Units in Prime and Central Regions?

Depends entirely on why you’re buying.

If your plan is renting to expat tenants, District 9 or District 10 addresses are genuinely attractive. Central locations pull the strongest tenant demand in Singapore, full stop.

But profitability tells a different story. Here’s what we found looking at actual resale transactions by district.

District

Area

Unprofitable Transactions

District 1

Marina Square, Suntec City, Raffles Place

37 of 48

District 11

Newton, Bukit Timah, Novena

34 of 52

District 7

Bugis, Beach Road

0 of 9

District 7 posted a perfect profitability record, worth noting, though with only 9 transactions, that’s a small enough sample that it’s more interesting than conclusive.

Zoom out and look at the top 10 districts for profitable transactions, and not a single one sits in the Core Central Region. Only two, Districts 7 and 20, come from Rest of Central Region. Everything else is Outside Central Region.

Part of the explanation is straightforward. OCR one-bedroom units go for under $750,000 fairly easily, giving them more room to appreciate percentage-wise. Central units start from a much higher base, so the same dollar gain looks smaller as a percentage.

That said, don’t ignore rental income in this equation. A pricier CCR one-bedroom, once you factor in the rent it pulls in, can genuinely outperform a cheaper OCR unit on total returns. Location alone doesn’t decide the winner here.

Do 1 Bedroom Properties in Singapore Actually Have Better Rental Yields?

Yes, and the data backs up what most agents will tell you anecdotally.

Typical gross rental yield for private residential property in Singapore sits around 2% to 3%. One bedroom properties consistently outperform that benchmark.

Out of more than 3,400 one-bedroom units we analysed, roughly 53% (1,812 units) achieved gross rental yields of 3% or higher. Only 15 units in the entire sample fell below 2.5%.

Metric

Result

Units analysed

3,400+

Units yielding ≥3%

~1,812 (53%)

Units yielding <2.5%

15

Typical private residential yield

2% – 3%

This is exactly why yield-focused investors keep circling back to smaller units. Lower quantum, strong demand from singles and young couples, and rents that don’t scale down proportionally with size.

Do Returns Improve the Longer You Hold a 1 Bedroom Unit?

Actually, no. This one surprises most people.

Holding Period

Profitable Transactions

Less than 3 years

81.82%

3 to 5 years

82.58%

More than 5 years

72.46%

Units held past the 5-year mark performed noticeably worse than those held for a shorter stretch. That’s counterintuitive if you assume property always gets better with time.

The likely explanation traces back to the property boom leading up to 2013. Buyers with limited capital rushed into one-bedroom units because they were the most affordable entry point, often at prices that were already stretched. Many held on for years hoping the market would recover, only to eventually sell at a loss once patience ran out.

The takeaway isn’t “sell quickly.” It’s that entry price matters more than how long you hold. A one-bedroom bought at a reasonable quantum in a normal market cycle doesn’t need a decade to prove itself.

Leasehold or Freehold: Which Wins for 1 Bedroom Units?

Leasehold, and by a fairly wide margin.

Tenure

Overall Profitable Transactions

Profitable After 5+ Year Hold

Leasehold (99-yr)

13.68%

82.7%

Freehold

8.6%

63%

Freehold units typically carry a price premium of up to 20% over comparable leasehold units. That premium has to be earned back through appreciation, and for one bedroom units specifically, the data shows it usually isn’t.

Even accounting for lease decay, which is the usual argument in favour of freehold, leasehold one-bedroom units still come out ahead. If you’re chasing returns on a small unit specifically, this is one of the clearer patterns in the data.

1 Bedroom vs 2 Bedroom vs 3 Bedroom: How Do They Actually Compare?

Bedroom count alone doesn’t decide performance. Here’s how the three most common configurations stack up against each other.

Factor

1 Bedroom

2 Bedroom

3 Bedroom

Typical gross rental yield

3.3% – 4.6%

2.8% – 3.8%

2.5% – 3.5%

Price per square foot (PSF)

Highest

Mid

Lowest

Quantum (entry price)

Lowest

Mid

Highest

Capital appreciation potential

Moderate

Strong, especially in RCR/OCR

Strong, family-driven demand

Resale demand pool

Smaller, niche

Largest, most liquid

Large, family upgraders

Best suited for

Yield-focused, single tenants

Balanced yield + appreciation

Long-term family stability

If your priority is rental income and a lower entry price, 1 bedroom properties in Singapore are hard to beat on paper. If your priority is capital appreciation and a faster resale down the line, 2 and 3 bedroom units in RCR or OCR tend to attract a deeper pool of resale buyers, mostly HDB upgraders and families, which usually translates into an easier and quicker exit.

Who Actually Rents 1 Bedroom Units?

Worth understanding your likely tenant before you buy, since it shapes everything from location choice to unit selection.

  • Single expat professionals working in or near the CBD, willing to pay a premium for a short commute.
  • Young couples without children, prioritising lifestyle and walkability over space.
  • Corporate short-term lets, particularly near business parks like one-north or Tuas.
  • Students near NUS, NTU, SMU, and SUTD, though this segment tends to be more price-sensitive.

This tenant pool skews toward people who move around often, which cuts both ways. You’ll likely re-let faster than a family unit would, but you may also see slightly higher turnover and the occasional vacancy gap between tenants.

Resale Liquidity: The Part Most Buyers Overlook

Here’s the tension nobody mentions at the showflat. One bedroom units rent fast. They don’t always sell fast.

The buyer pool for a one-bedroom resale unit is genuinely smaller. HDB upgraders, who make up a huge chunk of Singapore’s resale demand, are almost always looking for more space, not less. That leaves you competing for a narrower slice of investors and singles when it’s time to exit.

This doesn’t mean 1 bedroom properties in Singapore are bad investments. It means you should go in clear-eyed about your exit plan, not just your entry numbers.

SGLuxuryCondo

So, Are 1 Bedroom Properties in Singapore Worth It?

Looking at the data as a whole, profitable transactions clearly outnumber unprofitable ones for this segment. That points to 1 bedroom units being a reasonably low-risk entry point into property investment, not a gamble.

Three things worth remembering before you commit:

  1. OCR one-bedroom units tend to outperform CCR ones on returns, mainly due to lower entry quantum.
  2. 1 bedroom units beat 2 and 3 bedroom units on rental yield, but may take longer to sell when the time comes.
  3. Leasehold consistently outperforms freehold for this specific unit type, contrary to what most buyers assume.

Still, a one-bedroom won’t suit every investor. HDB upgraders generally want more space than a one-bedroom offers, and the pool of foreign tenants has thinned out compared to a few years back, which matters if central-district rental demand is central to your plan.

If you’re weighing a 1 bedroom unit against a bigger layout, our breakdown of which condo is good for investment in Singapore walks through the trade-offs in more depth, and our guide on how much a condo actually costs in Singapore is a useful companion read if quantum is your main concern right now.

Every investor’s situation is different, which is exactly why numbers on a page can only take you so far. If you’d like your specific budget and goals run against this data directly, our property consultation is a good place to start, and for a longer-term view on portfolio strategy, it’s worth speaking with a dedicated real estate master plan advisor.

At SG Luxury Condo, we’d rather show you what the transaction data actually says than repeat the showflat pitch. If you’re exploring luxury condos for sale in Singapore and trying to decide whether a 1 bedroom unit fits your goals, we’re happy to run the numbers with you.

Advanced Heading

Frequently Asked Questions

Are 1 bedroom properties in Singapore a good investment?

For rental yield, generally yes, the data consistently shows 1 bedroom units outperforming larger configurations. For capital appreciation and ease of resale, 2 and 3 bedroom units in RCR or OCR often do better. It depends on which outcome matters more to you.

Based on our analysis, most 1 bedroom units land between 3.3% and 4.6% gross yield, noticeably above the market average of 2% to 3% for private residential property overall.

CCR gives you stronger rental demand from expats, but OCR has historically shown better profitability on resale, mainly because entry prices are lower and leave more room for percentage gains.

Not necessarily. Our data shows units held 3 to 5 years actually outperformed those held over 5 years. Entry price and market timing matter more than simply holding longer.

Leasehold, based on the numbers. 99-year leasehold one-bedroom units showed a higher rate of profitable transactions than freehold ones, even after accounting for lease decay.

Generally yes. The buyer pool is smaller since most resale demand comes from HDB upgraders and families looking for more space, not less. Rental demand is strong, but resale demand is narrower.

It varies widely by district. OCR one-bedroom units can often be found under $750,000, while CCR one-bedroom units typically start well above that, sometimes crossing $1 million in prime addresses.

Mostly single expat professionals, young couples, and corporate short-term tenants near business hubs. Some student demand exists too, though it’s more price-sensitive.

Rarely as their own home, since most upgraders want more space for family. As an investment property held separately, though, a 1 bedroom unit can make sense for the yield alone.

Assuming high rental yield automatically means a good overall investment. It doesn’t account for resale difficulty, holding period risk, or the premium some buyers overpay for a prime address that the data doesn’t actually reward.

Singapore Property Price Index: What It Really Tells You
Categoriesarticles

Singapore Property Price Index: What It Really Tells You

Every quarter, URA drops a number, and half the property market reacts to it like it’s a verdict.

It isn’t. The Singapore Property Price Index is useful, genuinely useful, but only if you know what it’s actually measuring and what it’s leaving out. A lot of buyers glance at the headline percentage and make a decision off that alone, which is a bit like judging a whole neighbourhood off one house.

TL;DR

  • The Singapore Property Price Index (PPI) is published quarterly by URA and tracks overall private residential price movement, with 2009-Q1 set as the base of 100.
  • Q1 2026 saw the overall private residential price index rise 0.9% quarter-on-quarter and roughly 3.4% year-on-year.
  • OCR led price growth at +2.2% QoQ in Q1 2026, ahead of RCR (+0.8%) and CCR (+0.6%).
  • Landed property prices actually dipped 0.4% QoQ, while non-landed climbed 1.0-1.3% depending on the source.
  • HDB resale prices fell 0.1% QoQ in Q1 2026, the first quarterly dip in almost seven years.
  • The price index and median PSF measure different things. Don’t mix them up when comparing properties.
  • Use the index to spot where you sit in the property market cycle, not to time an exact entry point.

What Is the Singapore Property Price Index?

The Singapore Property Price Index is a quarterly measurement published by the Urban Redevelopment Authority (URA) that tracks how private residential prices move over time, relative to a fixed starting point.

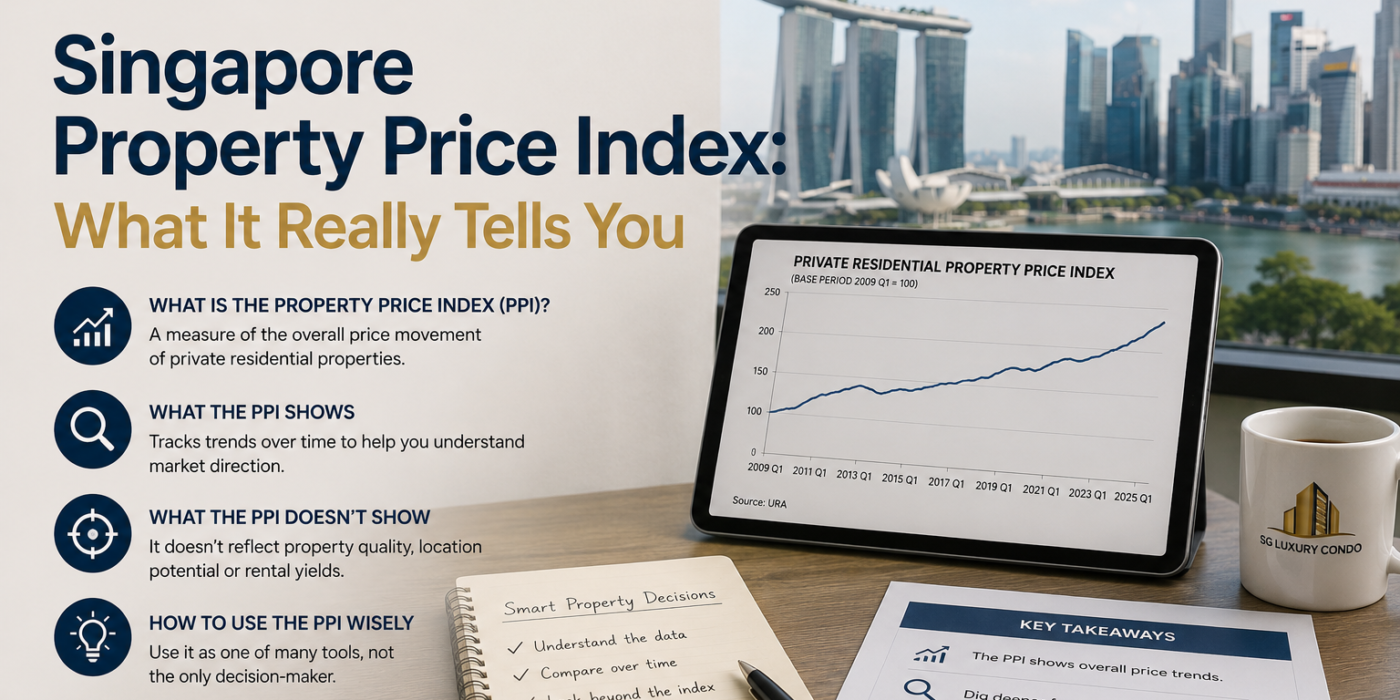
That starting point is 2009-Q1, which URA set at a value of 100. If today’s index reads 210, prices have roughly doubled since that base quarter. It’s not the average price of a condo. It’s a relative measure of price movement, which is a distinction that trips a lot of people up.

URA compiles it using caveats lodged with the Singapore Land Registry, cross-checked against Stamp Duty data from IRAS and developer sales data. The method used is a stratified hedonic regression, which basically means the index adjusts for the mix of properties transacted each quarter, rather than just averaging whatever happened to sell. Weights get revised every three years, using the value of properties transacted over the past five quarters.


The 5 Price Indices Singapore Actually Tracks

“The” property price index isn’t really one number. URA and other agencies track several, and each one answers a different question.

Index

What It Measures

Best Used For

Overall Private Property Price Index

Broad private residential price trend

Gauging general market direction

By Region (CCR/RCR/OCR)

Price movement split by location

Deciding which area to invest in

Landed vs Non-Landed

Price movement by property type

Comparing houses against condos

Commercial (Office vs Retail)

Office and retail price trends

Commercial property investors

HDB Resale Price Index

Public housing resale price trend

Deciding between HDB and private

If you’re only tracking one, the overall private residential price index is the headline number. But if you’re actually deciding where to put money, the regional breakdown matters far more.

Q1 2026 Snapshot: Where the Singapore Property Price Index Stands Now

Here’s how the latest quarter actually broke down, based on URA’s release.

Segment

QoQ Change (Q1 2026)

YoY Change

Overall Private Residential

+0.9%

~3.4%

Non-Landed (all regions)

+1.0% to +1.3%

~2.6%

Landed

-0.4%

~6.7%

CCR (non-landed)

+0.6%

2.6%

RCR (non-landed)

+0.8%

2.2%

OCR (non-landed)

+2.2%

1.6%

HDB Resale

-0.1%

Positive, but slowing

Rental Index (overall)

+0.3%

1.8%

A few things worth flagging. Landed property actually fell for the quarter after a strong prior quarter, largely on thinner transaction volume rather than any real change in sentiment. The HDB resale dip is small, but it’s the first quarterly fall in roughly seven years, and it’s worth watching if you’re an HDB upgrader weighing the jump into private property.

CCR vs RCR vs OCR: Reading the Regional Breakdown

The Singapore Property Price Index divides non-landed private property into 3 regions, and the label things more than most first-time buyers understand.

  • CCR (Core Central Region): Orchard, River Valley, Downtown Core, Sentosa. The comfort belt. Prices here stabilised in Q1 2026 after a rough Q4 2025, helped by new standard launches like Newport Residences and River Modern.
  • RCR (Rest of Central Region): City fringe zones like Queenstown, Novena, Toa Payoh, District 15. This has been the fastest-appreciating band over the last few years, thanks to new MRT access and a wave of 99-year launches.
  • OCR (Outside Central Region): Everywhere else, think Tampines, Punggol, Jurong, Woodlands. OCR led expansion in Q1 2026, driven greatly by strong HDB upgrader demand and a handful of well-received pitches like Pinery Residences.

The takeaway isn’t that OCR is “better” than CCR. It’s that each region responds to different demand drivers, upgrader activity in OCR, foreign and high-net-worth demand in CCR, and a mix of both in RCR. Reading the regional Singapore property price index numbers tells you which crowd is currently active, which matters more than the single overall number.

Property Price Index vs Median PSF: Why They Tell Different Stories

This confuses a lot of buyers, so it’s worth clearing up directly.

The price index measures the rate of change in prices, adjusted for the mix of properties sold that quarter. Median PSF is a snapshot of the actual price level for a specific location or project at a point in time.

Here’s why that distinction matters. A district can post a rising price index while its median PSF looks unchanged, simply because the mix of units sold shifted toward larger or smaller formats. Likewise, a single big launch at a high benchmark price can lift a region’s median PSF for a quarter without meaningfully changing the broader Singapore property price index.


Price Index

Median PSF

What it shows

Rate of price change over time

Absolute price level right now

Adjusts for property mix?

Yes

No

Best for

Spotting trend direction

Comparing specific units or projects

Common mistake

Assuming the index equals actual prices

Assuming one quarter’s PSF reflects the whole market

Use the index to understand direction. Use PSF to actually negotiate a price on a specific unit. Mixing the two up is how buyers end up either overpaying at a “hot” launch or walking away from a fair deal because they misread a single data point.

Understanding the Property Market Cycle

Property, like most asset classes, tends to move through four broad phases: recovery, expansion, hyper-supply, and recession. The Singapore property price index is one of the clearest ways to spot which phase the market is currently in.

  • Recovery: Prices have bottomed out and demand is quietly picking up, though headlines are still cautious.
  • Expansion: Prices and transaction volumes both climb, new launches sell well, and sentiment turns bullish.
  • Hyper-supply: Supply starts outpacing genuine demand, price growth slows or stalls even as sentiment remains upbeat.
  • Recession: Prices decline, transaction volume drops, and buyers wait on the sidelines for a bottom.

As of Q1 2026, the data points to a market in a measured expansion phase, prices are still climbing, but at a moderate, sustainable pace rather than the sharp run-ups seen in past boom quarters. Supply is being added steadily through the Government Land Sales programme, which tends to cap runaway price growth before it tips into a hyper-supply phase.

Knowing which stage you’re in matters more than knowing this quarter’s exact percentage. Buyers entering during recovery or early expansion generally get better long-term outcomes than those chasing prices in late expansion.

How to Actually Use the Price Index Before You Buy

Most people either ignore the Singapore property price index completely or obsess over the wrong part of it. Here’s a more useful approach:

  1. Check the regional trend (CCR/RCR/OCR) for the area you’re considering, not just the overall number.
  2. Compare the current index level against 3-5 years ago to see the real trajectory, not just this quarter’s blip.
  3. Cross-reference against the rental index if you’re buying for yield. Prices and rents don’t always move together.
  4. Watch the HDB resale index too, especially if you’re upgrading. A widening or narrowing gap between HDB resale and private OCR prices changes how expensive that upgrade actually feels.
  5. Treat single-quarter moves as noise. A 0.5% wobble one way or another rarely changes the underlying story.

The price index is a compass, not a stopwatch. It tells you direction far better than it tells you the perfect week to sign an OTP.

Reading the Index Is One Thing. Acting on It Is Another

The Singapore property price index tells you where the market has been and roughly where it’s heading. It won’t tell you whether a specific unit in a specific development is actually worth its asking price, or whether now is the right time for your personal situation.

That’s really where local, current judgment comes in, layering the index data against your own financing position, the specific project’s track record, and where that district sits in its own micro-cycle.

If you’re trying to work out whether current conditions favour buying in CCR, RCR, or OCR for your goals, it’s worth reading our take on the real estate market in Singapore, and if timing is your main concern, our piece on whether property prices will drop digs into that question more directly.

If you’d rather have someone walk through the current numbers against your specific budget and goals, our property consultation covers exactly that, and for a longer-term view on entry timing and portfolio strategy, it’s worth speaking with a dedicated Singapore property investment advisor.

At SG Luxury Condo, we track these numbers every quarter, not because the headline figure changes much week to week, but because knowing the trend behind it shapes which units are actually worth showing our clients. If you’re browsing luxury condos for sale in Singapore and want to know what the current index really means for your next move, we’re happy to walk through it with you.

Advanced Heading

Frequently Asked Questions

What was the Singapore property price index in Q1 2026?

Overall private residential prices rose 0.9% quarter-on-quarter and roughly 3.4% year-on-year in Q1 2026, based on URA’s release.

URA releases a flash estimate at the end of each quarter, followed by finalised figures roughly a month later. Full statistics, including regional and property-type breakdowns, come out on the 4th Friday of January, April, July, and October.

It’s a reference point, not a price. URA set 2009-Q1 as 100. If the current index reads 210, prices have roughly doubled since that quarter, in relative terms, not in absolute dollar value.

Over the last few years, RCR has generally led the pack thanks to new MRT lines and city-fringe launches. In Q1 2026 specifically, OCR posted the strongest quarterly growth, driven by resilient HDB upgrader demand.

No. The index is a relative, quality-adjusted measure of price change. Average or median transacted prices reflect the specific properties sold in a given period, which can be skewed by a handful of large launches.

Timing the exact bottom is genuinely difficult, even for professionals. It’s usually more productive to focus on your own financial readiness and the specific property’s fundamentals than to chase a market-wide dip that may not fully materialise.

Landed transaction volume was notably lower in Q1 2026, which made the index more sensitive to which specific bungalows or terraces changed hands that quarter. It reflects thinner trading more than a genuine reversal in demand.

Indirectly, yes. A large share of OCR private demand comes from HDB upgraders. When HDB resale prices are strong, upgraders have more equity to work with, which supports OCR private prices, and vice versa.

URA publishes the official data through their Property Market Information system, and data.gov.sg hosts the historical time series if you want to chart it yourself.

Flash estimates are generally close, usually within a fraction of a percentage point of the finalised number, but they can be revised once the full quarter’s caveats are processed.

Free 30 min Consultation Call
IT'S TIME TO DISCOVER
Your Dream Luxury Condo Home
CONTACT AGENT
Senior Realtor
JAMES LIM

Property Consultant & Analyst

Contact Us
FORM-ONE (footer and popup)

© 2026
SGLUXURYCONDO
ALL RIGHTS RESERVED.

USE OF THIS SITE CONSTITUTES ACCEPTANCE OF OUR TERMS OF USE AND PRIVACY POLICY