Current and Future Supply and Demand of Housing in Singapore
Categoriesarticles

Current and Future Supply and Demand of Housing in Singapore: What Buyers Should Know in 2026

TL;DR
Not reading the whole thing? Fair enough. Here’s the short version.

  • Singapore’s population is on track to hit 6.9 million by 2030, up from around 5.6 million a few years back, and that’s the single biggest force behind long-term housing demand.
  • About 78.6% of residents still live in HDB flats, down from 83.6% a decade ago. That gap is quietly feeding the private market.
  • The government tendered 4,575 private units through the 1H 2026 GLS Confirmed List, roughly 50% above the ten-year average. Combined with 2025’s numbers, that’s over 15,000 new private homes landing by 2027.
  • New supply takes three to four years to go from tender to TOP, so what’s completing now was decided years ago. Today’s tenders won’t show up as finished condos until closer to 2029 or 2030.
  • Central, land-scarce districts aren’t getting materially cheaper no matter how much OCR supply gets released. Location still beats national statistics.
  • Local demand (upgraders, new households, PRs) is carrying almost the entire market. Foreign buyers pay 60% ABSD, so they’re barely a factor right now.

If you want the reasoning behind each of those points, and where the opportunities actually are, keep going.

Every second buyer I talk to asks some version of the same question. Should I buy now, or wait for more supply to hit the market and bring prices down? It’s a fair question. It’s also, honestly, the wrong one, because it treats “supply” like a single dial someone in a government office turns up or down. It doesn’t work like that.

At SG Luxury Condo, we spend a fair amount of time going through URA data, GLS tender results, and household formation numbers so we’re not just repeating whatever the last headline said. This piece walks through what’s actually driving Current and Future Supply and Demand of housing in Singapore right now, and what’s likely to change over the next couple of years. Some of it will be obvious if you’ve followed the market. Some of it, I think, gets skipped over in most of the coverage out there.

Why Population Growth Alone Doesn’t Explain Housing Demand
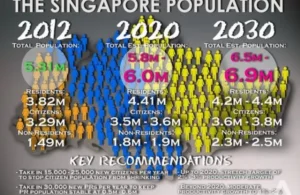
Singapore-White-Paper-Future-Population

Singapore’s population sat at roughly 5.6 million not long ago. The White Paper projection has it climbing to 6.9 million by 2030. People tend to stop there and assume more people equals more housing pressure, full stop. That’s true, but it’s only half the story.
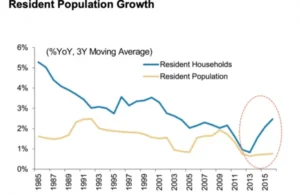
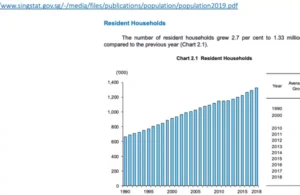
What actually moves the needle is household formation, not headcount. Singapore has averaged around 20,000 new households forming every year over the last five years, according to SingStat. Marriage rates run higher, closer to 27,000 a year, though plenty of newly married couples stick around with parents before buying their own place. Either way, that’s tens of thousands of new buyers entering the market annually, year after year, regardless of what the overall population figure does.
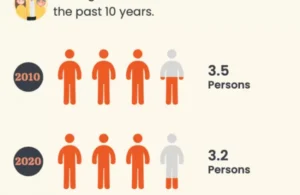
There’s a second piece too, and it’s the one nobody really talks about at dinner parties: households are getting smaller. Fewer multi-generational setups, more singles and couples living independently. Smaller households mean you need more units to house the same number of people. So even if population growth eventually slows, unit demand doesn’t necessarily slow with it.

Where Current and Future Supply and Demand of Housing in Singapore Actually Stands Today
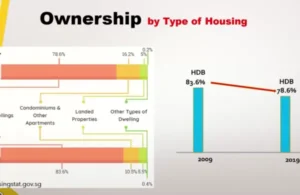
Here’s the current picture, roughly:

Housing Type

Share of Population

Direction of Travel

HDB (public housing)

~78.6%

Down from 83.6% a decade ago

Private property

~21.4%

Rising steadily

Overall ratio

Around 1 private unit for every 4 HDB units

Ratio has been narrowing

That declining HDB share isn’t an accident. New citizens and most PRs can’t buy HDB flats directly, and households earning above the S$14,000 BTO income ceiling get pushed toward the private market whether they planned to go there or not. Add upgraders looking for more space or a better location, and you’ve got a fairly steady stream feeding into condos, ECs, and resale private units.

The government has responded by pushing GLS supply harder than usual. The 1H 2026 Confirmed List alone tendered 4,575 private residential units, about 50% above the ten-year average. Stack that on top of the roughly 9,755 units already supplied in 2025, and you’re looking at somewhere north of 15,000 new private homes expected across 2026 and 2027.

That sounds like a lot. It kind of is. But supply doesn’t arrive the moment it’s announced.

The 2026-2028 Supply Pipeline, and Why the Timing Matters More Than the Number

This is the part I think gets glossed over in most “supply surge” headlines. A GLS tender awarded today doesn’t produce a finished home tomorrow. The typical gap between tender award and Temporary Occupation Permit (TOP) is three to four years. Which means the units completing right now, in 2026, were decided on back in 2022 or 2023. The land sold this year won’t show up as move-in-ready homes until 2029 or 2030.

A few patterns worth watching in the pipeline ahead:

  • Launches are getting more selective. Developers are chasing MRT-adjacent sites and smaller, sharper parcels rather than blanket expansion across the island.
  • Completion clustering is a real risk. When a handful of projects in the same district finish around the same window, rental and resale competition can spike locally even if the national numbers look calm.
  • Executive condos are having a moment. EC sales hit 1,168 units in Q1 2026, up over 40% year-on-year, the strongest quarter in eight years. HDB upgraders are clearly not sitting on the sidelines.
  • Foreign demand is basically muted. At 60% ABSD for foreign buyers, over 98% of 2025 transactions came from citizens and PRs. This is, functionally, a local market right now.

What’s Actually Pushing Demand (Beyond the Obvious)

Break it into pieces and it’s less mysterious than it sounds.

  1. Upgraders moving from HDB into private property remain one of the steadiest buyer groups Singapore has.
  2. New household formation adds roughly 20,000 buyers a year, one way or another.
  3. The BTO income ceiling forces a chunk of higher earners into the private market whether or not that was ever the plan.
  4. Older homeowners with accumulated wealth are using it to buy investment units or upgrade their own homes.
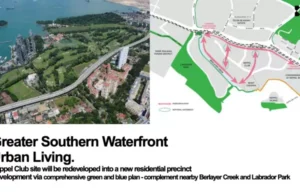
  5. Infrastructure expansion, the Cross Island Line, Greater Southern Waterfront, Punggol Digital District, Jurong Innovation District, is quietly redirecting demand toward areas that used to be overlooked.
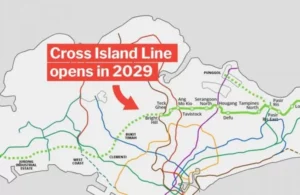
None of these are dramatic on their own. Together, they add up to a demand base that doesn’t really depend on any single factor holding steady.

Interest Rates and What They Do to Buyer Behaviour

I’d be lying if I said interest rates don’t matter, because they clearly do, just maybe not in the way people assume. When rates fell from around 4% to the 2.5-2.6% range, monthly repayments on a S$1 million loan dropped by roughly S$800. That’s not pocket change. It changes what people feel comfortable committing to, and it tends to pull hesitant buyers off the sidelines faster than any amount of new supply does.

The flip side matters too. If rates climb again, even the healthiest supply pipeline won’t stop demand from cooling, because affordability, not availability, is often the real constraint for most households. Watching MAS policy and US Fed moves tells you almost as much about near-term demand as any GLS report does.

En Bloc Redevelopment: The Supply Source Nobody Really Counts

Most supply conversations focus on GLS tenders and new launches, and skip over en bloc sales entirely. That’s a gap, because collective sales quietly recycle a decent chunk of Singapore’s older private housing stock back into the market as brand-new units.

When an ageing development gets sold en bloc, the existing (often larger, lower-density) units get demolished and replaced with a taller, denser new project, sometimes doubling or tripling the number of homes on the same plot. That’s genuine new supply that doesn’t show up in GLS statistics at all. It’s also why some districts with very little “new” land can still see a wave of fresh launches purely from redevelopment activity. If you’re trying to map future supply in a specific district, checking which older developments are en bloc candidates tells you almost as much as the URA Master Plan does.

Cooling Measures: The Government’s Way of Keeping This Balanced

None of the supply-demand dynamics above happen in a vacuum. Singapore’s cooling measures, ABSD rates, loan-to-value limits, the seller’s stamp duty, exist specifically to stop supply and demand from swinging too hard in either direction.

That’s worth remembering whenever someone tells you prices are about to “crash” because of a supply wave, or “spike” because of some demand surge. The government has, historically, adjusted these levers within months of seeing early warning signs. It happened with the 2021 and 2023 rounds of cooling measures, and there’s no real reason to think that playbook has changed. If anything, this is the biggest reason Singapore’s property market doesn’t move like Hong Kong’s or London’s, where policy tends to react much later and much more dramatically.

Supply vs Demand: The Balancing Act, in One Table

Factor

Current Position (2026)

Where It’s Headed

Population

~5.6M trending to 6.9M by 2030

Still climbing, slower pace

New private home supply

15,000+ units expected 2026-2027

Elevated vs. historical average

New household formation

~20,000/year

Steady, reliable demand driver

Foreign buyer demand

Subdued (60% ABSD)

Likely to stay muted short-term

Central Region supply

Land-scarce, few new sites

Prices likely stay firm

OCR/mass-market supply

Bulk of GLS sites located here

More room for price moderation

En bloc redevelopment

Ongoing in select mature estates

Adds supply outside official GLS numbers

So does supply keep pace with demand? Mostly, with a lag, and very unevenly by district. Singapore isn’t drifting toward the kind of imbalance that causes runaway price spikes. It’s also not flooding the market enough to crash values. The whole planning system, GLS releases plus cooling measures plus en bloc activity, is built to avoid both extremes. What’s left is a market where the district you pick matters more than any national statistic.

What This Actually Means If You’re Buying

I won’t pretend to know the exact month prices move one way or the other. Nobody does, and anyone claiming otherwise is selling something. But a few things fall out of this data pretty clearly.

  • If you want something in the Core Central Region or freehold land, don’t wait around for supply relief. There isn’t enough land there for the GLS pipeline to make a real dent.
  • If you’re flexible on location, the 2026-2027 completion wave in the OCR could give you more room to negotiate and a wider pool of resale choices.
  • If you’re upgrading from HDB, know that EC sales are at an eight-year high. Good units in good spots are still moving quickly, supply surge or not.
  • National “supply surge” headlines rarely apply evenly. Some districts will feel genuinely oversupplied. Others stay tight regardless of what the aggregate numbers say.

This is exactly the kind of district-level nuance a property investment advisor is useful for, since national statistics won’t tell you what’s happening on one specific street.

The Bottom Line

Singapore’s housing market isn’t a story of “more supply means lower prices” or “rising population means prices only go up.” It’s layered. Population growth and household formation push demand up. GLS supply tries to keep pace but arrives with a three-to-four-year lag. En bloc redevelopment adds supply nobody counts in the headline numbers. And land scarcity in the centre of the island insulates certain districts from whatever happens at the national level.

If you’re weighing a purchase, whether it’s your first move out of an HDB flat or you’re comparing luxury condos for sale in Singapore as an investment, the national numbers matter less than how they apply to the specific project and district in front of you.

Want a second opinion before you commit? We track GLS tenders, en bloc activity, and URA Master Plan updates district by district. Get in touch for a free property consultation and we’ll walk you through what the Current and Future Supply and Demand of Housing picture actually means for the unit you’re eyeing.

Worth a read alongside this one: our breakdown of 2025-2026 launch price predictions and the H2 2025 property outlook for a closer look at pricing by segment.

Sources referenced: SingStat, URA GLS Confirmed List (1H 2026), DBS Property Market Outlook, Savills Research, ERA Realty transaction data.
Advanced Heading

Frequently Asked Questions

Will Singapore property prices crash because of new Current and Future Supply and Demand of Housing?

Unlikely in the near term. The government actively manages GLS releases and adjusts cooling measures when needed, and structural demand from upgraders and new households provides a floor under prices.

It depends heavily on district. Central, land-scarce areas aren’t likely to get materially cheaper. OCR areas with heavier supply may offer more negotiating room.

Every new household needs somewhere to live. With around 20,000 forming annually, and the BTO income ceiling pushing some buyers into the private market, this is a steady and often underrated demand driver.

It shapes where new supply lands. Areas earmarked for rezoning, like the Greater Southern Waterfront or Paya Lebar, will see fresh residential stock over the next decade, which shifts the local supply-demand balance.

Yes, and it’s often missed. Collective sales replace older, lower-density developments with new, denser ones, adding units that don’t show up in official GLS supply figures.

The 60% ABSD rate for foreign buyers makes Singapore property expensive relative to other markets for non-residents. Over 98% of 2025 transactions came from citizens and PRs.

Typically three to four years from tender award to TOP. Supply announced this year won’t be move-in ready until closer to 2029 or 2030.

EC demand is strong, sales hit an eight-year high in Q1 2026, but supply of new EC sites is limited, so good units tend to sell quickly.

OCR districts near GLS Confirmed List sites, along with areas near new MRT lines like the Cross Island Line, are expected to see the bulk of new completions.

Lower rates make monthly repayments more manageable and tend to pull hesitant buyers back into the market faster than new supply alone can cool demand. Rate hikes have the opposite effect.

Undervalued vs Profitable Properties in Singapore
Categoriesarticles

Undervalued vs Profitable Properties in Singapore: What’s the Real Difference (2026 Guide)

“Do you have any undervalued properties?” It’s probably the question we get asked most often at SG Luxury Condo, usually within the first five minutes of meeting a new client. It’s a fair question. Everyone wants to buy today’s price at yesterday’s discount, and honestly, who wouldn’t?

But here’s the thing most people get wrong. Cheap and profitable aren’t the same thing, and mixing the two up is exactly how buyers end up holding a property that ticked the “good deal” box but never actually made them money. Understanding the real difference between undervalued vs profitable properties is one of the most useful lessons a Singapore property investor can learn early, and it’s a conversation SG Luxury Condo has with nearly every client before they even start viewing units, so let’s break it down properly.

TL;DR: An undervalued property is priced below its actual market value or bank valuation, typically 5% to 15% lower. A profitable property is one that genuinely delivers strong returns over time, usually because it sits in a growth location with real demand behind it. These aren’t the same category. A property can be undervalued without being profitable, and a profitable property is sometimes not undervalued at all, it’s simply priced fairly for what it’s worth. When comparing undervalued vs profitable properties, the safer long-term bet is almost always the one with genuine growth drivers behind it, not just a lower sticker price.

What Is an Undervalued Property?

Singapore-Property-Resale-Price-Index

An undervalued property is one selling for less than its actual worth, meaning the asking or transacted price sits below its market value or bank valuation. Most industry practitioners consider a property meaningfully undervalued when it’s priced 5% to 15% below valuation. On a $2 million unit, that’s anywhere from $100,000 to $300,000 in potential savings, which explains why the phrase gets thrown around so much.

Undervalued properties tend to be older, and because of that, they often appeal to buyers chasing higher rental yield rather than capital growth, since the entry price is lower relative to the rent they can still command.

How to Spot an Undervalued Property

A few consistent signals show up again and again when a property is genuinely undervalued:

  • It’s been sitting on the market a while. Difficulty selling is often the first clue, sellers lower their asking price to attract interest.
  • Low transaction volume in the area. Thin transaction activity makes it harder for a property to find its “true” price, which can leave it undervalued relative to nearby comparables.
  • A motivated or distressed seller. Someone who’s already committed to another property, is going through a divorce, or is facing financial pressure will often accept a below-valuation offer just to close quickly.
  • Older age, typically 10 to 15 years plus. Older stock usually trades at a lower psf to begin with, which can compound into a genuine undervaluation if the surrounding area has improved since the building went up.
  • A meaningful price gap versus a nearby new launch. If a resale unit nearby is priced 15% to 20% below a comparable new launch in the same postal district, that gap is worth investigating closely.

What Is a Profitable Property?

Profitable Properties

A profitable property is one that delivers a real return when you eventually sell it, or through rental income along the way. This is the metric that actually matters if wealth-building, not just a cheaper purchase price, is your goal.

How to Spot a Profitable Property

  • Strong, consistent demand. When buyers are willing to pay at or above bank valuation, that pressure pushes future valuations up too, creating a positive cycle.
  • A great or growth location. Central Region addresses, or fringe areas with a confirmed upcoming catalyst like a new MRT line or a URA rezoning, tend to outperform.
  • Younger age, typically under 5 years. Newer projects usually see stronger initial demand, since buyers are willing to pay more for modern layouts, facilities, and specs.
  • A real growth catalyst behind it, not just current sentiment. This could be a confirmed transport line, a masterplan rezoning, or a nearby transformation like a business district taking shape.

Undervalued vs Profitable Properties: Where People Get Confused

Undervalued VS Profitable Properties

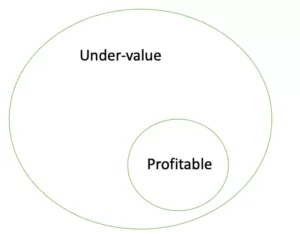
Here’s the misconception that trips up so many first-time investors. Buying something cheap feels like it should automatically be profitable. It isn’t, not necessarily. When you’re weighing undervalued vs profitable properties, remember this rule: an undervalued property is not always profitable, but a profitable property can sometimes also be undervalued, and that combination is the real jackpot when you can find it.


Undervalued Property

Profitable Property

Defining trait

Priced below market value or bank valuation

Delivers strong capital or rental returns over time

Typical age

10 to 15+ years

Usually under 5 years

Typical location

Anywhere, including quieter or less popular pockets

Central Region or areas with a confirmed growth catalyst

Why it’s priced that way

Distressed seller, low transaction volume, hard to sell

Strong demand, developer pricing strategy, first-mover advantage

Main risk

Cheap for a genuine reason (poor condition, weak location, oversupply)

May already be priced close to full value, limiting further upside

Best suited for

Rental yield seekers, patient renovators

Capital growth investors, those buying for long-term appreciation

Just like you’d raise an eyebrow at a hawker stall selling food suspiciously cheap, it pays to dig into why a property is priced below valuation before assuming it’s a bargain. Sometimes it genuinely is undervalued. Sometimes it’s cheap because the area has stalled, the building is poorly maintained, or there’s simply no fresh catalyst in sight.

Two Real Case Studies

Numbers make this a lot easier to see clearly, so here are two comparisons worth studying.

Queenstown, 2015: The Queens vs Commonwealth Towers

Case Study 1 – Queenstown

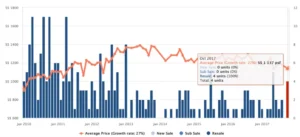
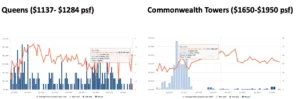
Back in 2015, resale project The Queens (completed 2002) was trading around $1,137 psf, comfortably below its 2014 peak of $1,400 psf, a textbook undervalued property on paper. Meanwhile, Commonwealth Towers, a Building Under Construction launch at the time, was selling at $1,600 to $1,700 psf, noticeably pricier.

Queens-vs-Commonwealth-Towers

Fast forward to 2020: The Queens had crept up to roughly $1,284 psf, a 2.29% annualised return. Commonwealth Towers, despite its higher entry price, had climbed to around $1,950 psf, a 5.13% annualised return, more than double The Queens’ growth. The cheaper, undervalued option actually underperformed the pricier, profitable one.

Bartley, 2015-2020: Bartley Residences vs Botanique @ Bartley

Case Study 2 – Bartley

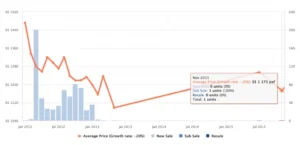
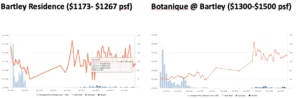
Bartley Residences, which had peaked at $1,480 psf, was trading around $1,173 psf by 2020, roughly 30% below its own past valuation. Across the road, Botanique @ Bartley by UOL sat at $1,300 to $1,400 psf, clearly the pricier option at the time.

Over that same window, Bartley Residences grew from $1,173 to $1,267 psf, a 1.48% annualised return. Botanique grew from $1,300 to $1,500 psf, a 3.07% annualised return, again, more than double.

Bartley-Residence-vs-Botanique-at-Bartley-Price-Index

Both case studies land on the same lesson. The cheaper, more “undervalued” option looked like the smarter buy on paper, but the pricier, better-positioned option delivered the stronger actual return. That’s the undervalued vs profitable properties trade-off in its clearest form, and it’s a pattern SG Luxury Condo has seen repeat itself across dozens of similar comparisons since.

Where This Plays Out in Today’s Market

The same pattern shows up in current market discussions too. Analysts have pointed to areas like Jurong West, Woodlands, the Paya Lebar and Geylang fringe, Bayshore, and Tengah as pockets carrying genuine undervalued potential right now, each backed by a specific catalyst rather than just a lower price tag. Jurong West sits next to the Jurong Lake District’s ongoing transformation into a second CBD. 

The Paya Lebar and Geylang fringe stands to benefit once the Paya Lebar Airbase relocation eventually lifts long-standing height restrictions nearby. Bayshore is riding the wave of a brand new estate taking shape around it.

The distinction matters here too. These aren’t cheap for no reason, they’re undervalued specifically because the market hasn’t fully priced in a confirmed future catalyst yet. That’s a very different situation from a property that’s cheap simply because nobody wants it. Our guide on using the URA Master Plan to navigate property investment goes deeper into how to spot these catalysts before the wider market catches on.

How to Actually Find Undervalued and Profitable Properties

For undervalued properties, a bank valuation is the traditional route, but it’s not the only option. EdgeProp Singapore lets you search specifically for undervalued listings and see exactly how far below valuation each one sits, which saves a trip to the bank. Comparing the price gap between a new launch and nearby resale stock in the same postal district is another reliable method, a gap of 15% to 20% or more is usually worth a closer look.

For profitable properties, the process is trickier, since you’re betting on future demand rather than reading a number off a valuation report. At SG Luxury Condo, we built our Property P.L.U.S System and 4 “P” framework specifically to help clients cut through this, weighing location, price trajectory, unit mix, and upcoming catalysts together rather than looking at any single factor in isolation.

So Which Should You Actually Buy?

It depends on your goal, and being honest with yourself about that goal matters more than the label on the property. If you’re chasing rental yield and you’re comfortable holding an older asset, a genuinely undervalued property can work well, provided you’ve confirmed why it’s cheap and you’re comfortable with that reason. If you’re building long-term wealth through capital appreciation, a profitable property with a real growth catalyst behind it, even at a fuller price, has historically outperformed the cheaper alternative in case after case.

The ideal outcome, of course, is finding a property that’s both undervalued and profitable, priced below its true worth today, with a confirmed catalyst that the wider market hasn’t fully appreciated yet. Those opportunities exist, but they take real digging to find, which is exactly why so many buyers end up settling for one half of the equation instead of both.

A Word From SG Luxury Condo

We’ve watched plenty of clients get tempted by a lower psf number, only to realise months later that the pricier alternative next door was actually the smarter buy. Understanding the real gap between undervalued vs profitable properties is one of the clearest ways to avoid that regret before you sign anything.

If you’re weighing a specific shortlist and want help figuring out which side of this equation a property actually falls on, SG Luxury Condo is happy to run the numbers with you. Our property consultation sessions cover exactly this kind of comparison, and if you’d rather avoid the common traps altogether, our guide on how to avoid unprofitable properties pairs well with this one. 

You’re also welcome to browse our full range of luxury condos for sale in Singapore if you’re ready to start shortlisting.

Advanced Heading

Frequently Asked Questions

Is an undervalued property always a good investment?

Not necessarily. A property can be undervalued for a genuinely bad reason, poor condition, weak location, or no catalyst in sight, in which case it may stay cheap indefinitely rather than catching up to its “true” value.

Most industry practitioners consider a property meaningfully undervalued when it’s priced 5% to 15% below its bank valuation or comparable market value.

Yes, and that combination is the ideal outcome every investor is chasing. It happens when a property is priced below its true worth today while also sitting on a confirmed future growth catalyst the wider market hasn’t fully priced in yet.

In both the Queenstown and Bartley examples, the pricier option benefited from being a newer project with stronger buyer demand and, in one case, a clear first-mover advantage in an area without other new launches nearby. Those growth drivers mattered more than the lower entry price of the undervalued alternative.

Property portals like EdgeProp let you search specifically for undervalued listings and see the percentage gap versus valuation directly. Comparing a resale unit’s psf against a nearby new launch in the same district is another practical shortcut.

Not always, but age is one of the more consistent signals. Older properties typically trade at a lower psf to begin with, and if the surrounding area has improved meaningfully since the building went up, that combination often creates a genuine undervaluation.

Many investors treat a 15% to 20% gap as worth investigating closely, though the right number depends heavily on the specific district and how comparable the two properties actually are.

For most first-time buyers, especially those buying to live in the property rather than purely for investment, a profitable property in a solid, well-connected location is usually the safer long-term choice over chasing the lowest possible entry price.

Not always, but it’s a common contributing factor. Thin transaction activity makes it harder for a fair market price to establish itself, which can leave genuinely good properties trading below what they’re actually worth simply due to a lack of recent comparable sales.

Areas like Jurong West, Woodlands, the Paya Lebar and Geylang fringe, Bayshore, and Tengah have all been flagged recently, each tied to a specific confirmed catalyst rather than simply being cheap for no reason.

Property Decoupling in Singapore
Categoriesarticles

Void spaces or area in a condominium property: What It Really Means and Why You Might Be Paying for Air

slide-home

Ever walked into a showflat, looked up at a soaring double-height ceiling, and thought “wow, this feels so much bigger”? That feeling is real. What’s not always obvious is that a chunk of the square footage creating that feeling might be a void area, and you could be paying full price for space you can’t actually stand in.

This trips up more buyers than you’d expect, including some who’ve bought multiple properties before. At SG Luxury Condo, we walk every client through their floor plan line by line before they sign anything, specifically because void area is one of the easiest things to miss and one of the most annoying things to discover after the fact. It’s a small detail with a real dollar impact, and it’s exactly the kind of thing SG Luxury Condo flags early rather than letting a client find out during their first week moving in.

TL;DR: A void area is empty space above the floor in a strata unit, usually created by a high ceiling, that still counts toward the unit’s total saleable floor area even though you can’t walk on it or furnish it like normal living space. It’s common in penthouses, strata landed homes, and loft-style units. The key thing to know is that void area typically sells at only 30% to 50% of the psf price of regular floor area, which means the unit’s average psf on paper can look artificially low. Always check the Sale and Purchase Agreement, or the Subsidiary Strata Certificate of Title for resale units, before assuming your quoted floor area is all usable space.

What Exactly Is a Void Area?

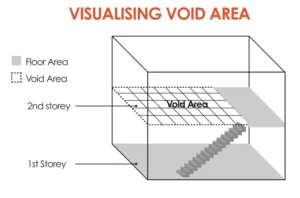
A void area is empty space that sits above the floor within a strata unit, but which the developer still counts as part of the unit’s total saleable floor area. It typically shows up in units with a ceiling height of around 3.2m or more, noticeably taller than the standard 2.75m to 2.9m ceiling in a typical condo unit.

Void-Space-Area

Think of a double-volume living room, or the open space above a staircase leading up to a loft. Visually, it’s dramatic. Functionally, you can’t put a bed in it, you can’t stand in it, and depending on the specific layout, you might not even be able to walk through the upper portion of it at all.

The exact breakdown of a unit’s floor area, including whether it contains void area and how much, is stated in the Sale and Purchase Agreement (S&P) for new launches, or the Subsidiary Strata Certificate of Title (SSCT) for completed resale units issued on or after 1 August 2012.

Where You’ll Typically Find Void Area

Void area isn’t unique to any one property type, but it does show up more often in certain layouts:

Examples-of-Void-Spaces

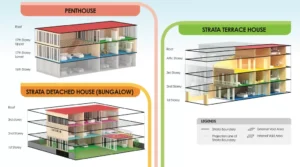
  • High-rise penthouses, especially those marketed around a dramatic double-volume living or dining space
  • Strata detached houses and bungalows, where high ceilings are part of the architectural draw
  • Strata terrace houses, particularly newer designs with loft-style upper floors
  • Loft-style apartments, where the “loft” portion above a staircase may or may not be usable, standing headroom depends entirely on the specific design

It’s worth noting that not every loft unit has void area. Generally, if the loft deck’s ceiling isn’t tall enough for an adult to stand comfortably, developers often don’t count that portion as void area at all. Practices differ from developer to developer and project to project, which is exactly why you shouldn’t assume anything without checking the paperwork.

The Part Most Buyers Miss: You’re Paying for Air

Here’s the bit that actually matters for your wallet. Void area typically transacts at roughly 30% to 50% of the psf price of normal, walkable floor area. Developers and sellers know this, and it shows up in how units get priced and marketed.

Here’s a simple side-by-side to show why this matters.


Unit A (with void area)

Unit B (no void area)

Total Floor Area

2,000 sq ft (includes 500 sq ft void area)

1,500 sq ft (fully usable)

Average PSF

$1,300

$1,600

Total Price

$2,600,000

$2,400,000

At first glance, Unit A looks like the better deal, bigger space, lower psf. But strip out the void area and Unit A actually only has 1,500 sq ft of genuinely usable floor space, exactly the same as Unit B, and it costs $200,000 more. The lower headline psf on Unit A isn’t really a discount. It’s just the void area quietly dragging the average down.

This is exactly why comparing two units purely on advertised psf can be misleading if one of them carries void area and the other doesn’t. Always ask specifically how much of the quoted floor area is void before comparing prices across units, it’s one of the first checks SG Luxury Condo runs whenever a client is torn between two similarly priced options.

A Real Example of Why This Matters

This isn’t just a theoretical concern. In one case from 2014, a couple who’d paid an option fee on an executive condominium penthouse later argued the unit felt smaller than they’d expected and took the developer to court. The developer’s position was that the Option to Purchase had clearly stated the total saleable floor area included the air-conditioner ledge, roof terrace, and void area of the unit, all spelled out in the paperwork the couple had signed. The case didn’t proceed to a full ruling, but it’s a useful reminder that once you’ve signed, the law generally expects you to have read and understood what you were buying.

How to Check Before You Buy

Whether you’re buying a new launch or a resale unit, here’s exactly what to do before you sign anything.

  1. For new launches, developers are required to give buyers a description and estimated area breakdown of every space, including any void area, before accepting a booking fee. You’ll need to sign written confirmation that you received this. Read it properly before handing over that fee.
  2. For sub-sale (uncompleted resale) units, ask the seller for their Certificate of Strata Area before you pay the option fee. It states the unit’s floor area and whether any void area is included.
  3. For completed resale units, buy a copy of the Subsidiary Strata Certificate of Title (SSCT) from SLA. For SSCTs issued on or after 1 August 2012, void areas are shown explicitly. You can also purchase the Strata Certified Plan (CPST) through SLA’s Integrated Land Information Service (INLIS) for extra confirmation.
  4. If you’re still unsure, don’t be afraid to just walk away from the deal. If a unit’s void area classification feels unclear or the agent can’t explain it properly, that ambiguity alone is a reasonable reason to look elsewhere.

Can You Deck Over a Void Area to Get More Usable Space?

Some owners look at a double-volume void space and think, why not just build a floor across it and gain an extra room? Technically possible, but not something you can just decide to do on your own.

You’ll need two separate approvals before any decking work happens:

  • Consent from the Management Corporation Strata Title (MCST), which requires at least 90% of share value in favour of the proposal at a general meeting. Getting there isn’t always easy, especially in larger developments with more owners to convince.
  • Approval from the Urban Redevelopment Authority (URA), since decking over a void area effectively adds floor space, which can push a development’s Gross Floor Area (GFA) beyond what’s approved. Void areas are specifically excluded from GFA calculations as they stand, so converting one into usable floor space changes that equation.

Skipping either approval isn’t just a formality issue. Unauthorised structural changes can create real problems if you ever try to sell the unit or if the MCST later requires you to reverse the work. SG Luxury Condo always advises clients to get both approvals in writing before any contractor touches the space.

Is Buying a Unit With Void Area a Good Idea?

It depends entirely on what you value. If the dramatic ceiling height and sense of space genuinely matter to you, and you go in understanding exactly how much of the quoted area is void, there’s nothing wrong with it. Some buyers love the architectural drama enough that the trade-off is worth it.

Where it becomes a problem is when a buyer doesn’t realize the void area exists at all, and ends up disappointed that their “2,000 sq ft home” feels a lot smaller once they move in. Understanding your actual usable floor area, not just the number printed on the listing, is the difference between a happy purchase and a frustrating one. Our guide on how to read a floor plan properly goes deeper into spotting these details before you commit, and it pairs well with this topic since void area is exactly the kind of thing a poorly read floor plan can hide.

A Word From SG Luxury Condo

We’ve sat with clients staring at a floor plan trying to figure out why a unit felt smaller in person than the numbers suggested, and nine times out of ten, void area was the answer. It’s not a scam, and it’s fully disclosed if you know where to look, but it’s exactly the kind of detail that’s easy to gloss over when you’re excited about a showflat.

If you’re comparing a few units and want a second pair of eyes checking for void area, strata quirks, or anything else hiding in the fine print, SG Luxury Condo is happy to walk through the paperwork with you before you commit. Our property consultation sessions cover exactly this kind of due diligence, and if you’re specifically eyeing a penthouse or loft-style unit, our luxury condo real estate agents can pull the SSCT and floor plan details for you before you even schedule a viewing. 

You can also browse our full range of luxury condos for sale in Singapore if you’re still shortlisting where to start. For more tips on what to check before falling for a showflat, our guide on picking your dream condo unit is worth a read alongside this one.

Advanced Heading

Frequently Asked Questions

What is a void area in a condominium, in simple terms?

 It’s empty space above the floor in a strata unit, usually created by a ceiling higher than the standard 2.75m to 2.9m, that still counts toward the unit’s total saleable floor area even though you can’t use it like normal living space.

Not necessarily, but it’s common, since penthouses are often marketed around dramatic double-volume living spaces. Always check the S&P or SSCT rather than assuming based on the unit type alone.

Typically around 30% to 50% of the psf price of normal floor area. This is exactly why comparing two units purely by average psf can be misleading if one includes void area and the other doesn’t.

For units with an SSCT issued on or after 1 August 2012, void area is stated explicitly on the certificate. You can also purchase the Strata Certified Plan (CPST) through SLA’s Integrated Land Information Service for further confirmation.

Only with approval. You’ll need at least 90% share value consent from the Management Corporation Strata Title (MCST), plus approval from URA, since the work can increase the development’s Gross Floor Area beyond what’s currently approved.

It’s not necessarily illegal in a criminal sense, but unauthorised structural changes without MCST and URA approval can create serious problems later, including complications when selling the unit or MCST-ordered reversal of the work.

Because the space is legally recognized as part of the strata lot’s boundary, even if it’s not fully walkable. It’s disclosed in the S&P specifically so buyers can see exactly what they’re purchasing before committing.

Void areas within your unit’s boundary are generally part of your private strata lot, not common property, which is different from shared spaces like corridors or the void deck of an HDB block. Always confirm this in your specific unit’s documentation.

Ask for the S&P or SSCT directly rather than relying on verbal explanations. If the paperwork itself is unclear or the agent seems unsure, that’s a reasonable signal to slow down or walk away from the deal entirely.

It can. Since void area is priced lower per square foot, a unit with a large proportion of void area may see slower psf appreciation on that portion compared to fully usable floor space, and future buyers will likely scrutinise the breakdown just as carefully as you should when buying.

The MRT Effect on Property Prices in Singapore
Categoriesarticles

The MRT Effect on Property Prices in Singapore (2026 Update)

Ask any property agent in Singapore what the first thing they check on a listing is, and a good chunk will say the same thing: how far is it from an MRT station? It’s become such a reflex that buyers sometimes forget to ask the more useful question, which is exactly how much that distance is worth, and when in a station’s life cycle it’s worth the most.

That’s really what the MRT Effect on Property Prices is about. It’s not just “closer is better.” The actual pattern is more interesting, and more useful, once you understand the different stages a station goes through, from announcement to construction to opening, and how each stage moves prices differently. 

At SG Luxury Condo, we walk clients through this pattern constantly, especially with the Cross Island Line and Jurong Region Line both actively reshaping parts of the island right now. Understanding the MRT effect properly, rather than just assuming “near MRT is always good,” is one of the first things SG Luxury Condo covers with new investors.

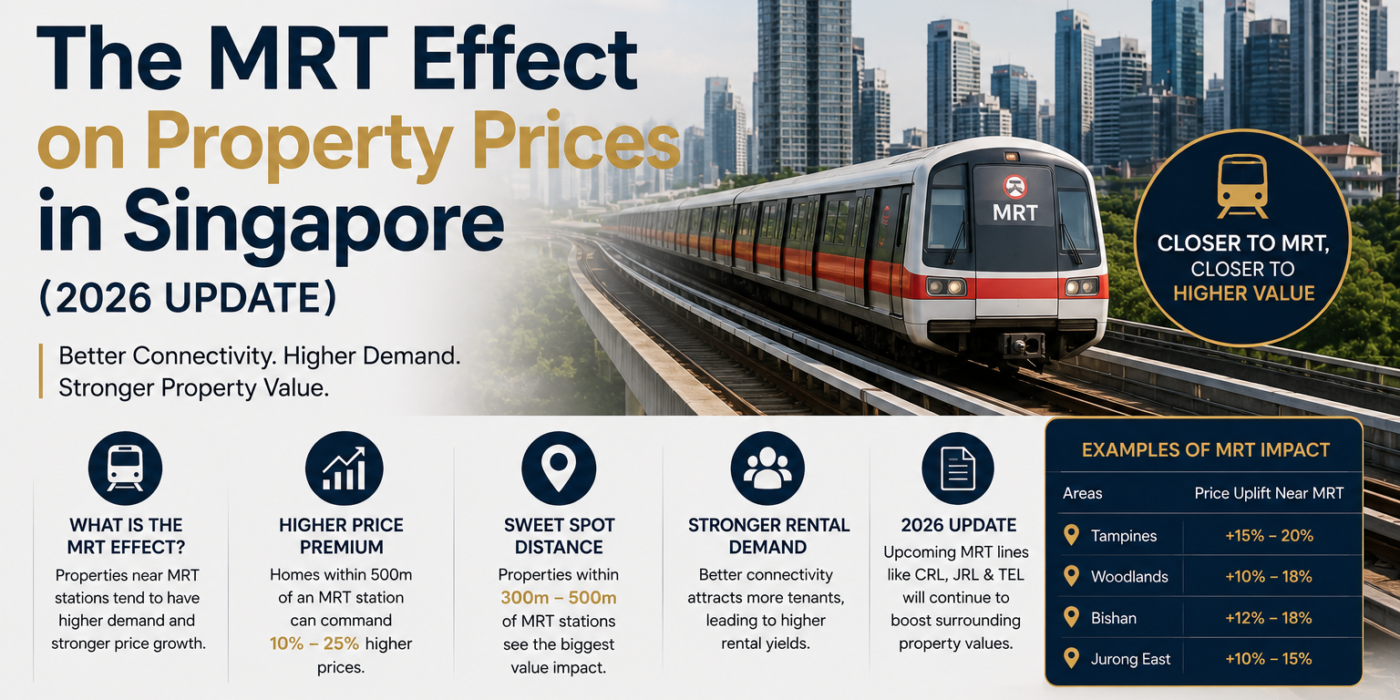
TL;DR: The MRT effect on property prices in Singapore plays out in four distinct stages. Prices tend to rise right after a new line is announced, dip during the noisy construction phase, and then rise again once the station actually opens, typically by 3% to 8% within 12 to 24 months of opening. Properties within 400m to 500m of a station generally command a 10% to 20% premium over similar units further away. The catch is that a lot of this premium gets priced in early, sometimes years before a station even opens, so timing matters just as much as location.

A Quick Recap: Singapore’s MRT Network Today

Singapore’s MRT system started small. The first five stations, Yio Chu Kang, Ang Mo Kio, Bishan, Braddell, and Toa Payoh, opened on 7 November 1987 along a 6km stretch of the North South Line. Today the network has grown to roughly 200 stations across the island, carrying millions of commuters daily, with two more lines actively under construction and reshaping how the MRT Effect on Property Prices plays out in previously underserved neighbourhoods.

Two upcoming lines matter most for anyone studying the MRT effect right now:

  • Jurong Region Line (JRL) – opening in phases from 2027, serving Tengah, Choa Chu Kang, Boon Lay, NTU, and the Jurong Innovation District
  • Cross Island Line (CRL) – Singapore’s longest MRT line at over 50km, cutting across the island from Changi to Tuas. Phase 1 opens in 2030, Phase 2 (including the Punggol Extension) in 2032, and Phase 3 construction is slated to begin in 2027 with completion in the late 2030s

The government’s long-standing target, first set in 2013, is for 8 in 10 households to live within a 10-minute walk of an MRT station by 2030. That goal is a big part of why the MRT effect keeps mattering so much to Singapore property values, more stations are always on the way.

Stage 1: The Announcement Effect

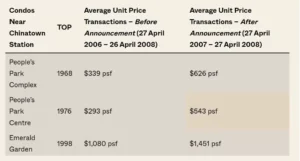
The first, and often largest, price movement happens the moment a new MRT line or station is officially announced, well before a single piece of track gets laid. This is the earliest and arguably most important stage of the MRT effect.

Interestingly, the size of this bump depends heavily on the age and prior accessibility of the area. In older estates that previously had poor MRT access, the announcement effect tends to hit hardest, since these units usually start from a lower psf base, and even a modest percentage jump adds up to a meaningful dollar amount once you factor in typically larger unit sizes in older developments.

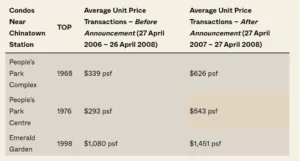
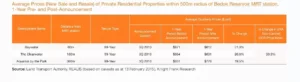
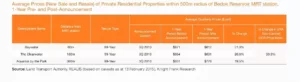
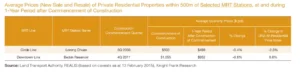
New launches benefit too, just differently. Developers routinely factor an announced MRT line into their pricing, setting new benchmark prices for units they hadn’t even priced before the announcement. Historical data on developments near Bedok Reservoir MRT showed new sale average prices climbing over 30% in the year following the station’s announcement, a clear sign developers were pricing in the MRT effect from day one.

Stage 2: Proximity’s Ongoing Effect

Once the initial announcement bump settles, proximity to the station becomes the dominant factor in ongoing pricing. This part of the MRT effect is the most consistent and well-documented across multiple independent studies.

Distance to MRT Station

Typical Price Premium

Within 400m (direct walkable catchment)

Full premium, 10% to 20%

400m to 800m

Partial premium

Beyond 800m

Premium largely disappears

Direct basement/podium integration (e.g. Lentor Modern, J’Den)

Strongest and most durable premium

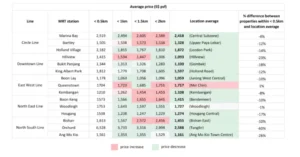
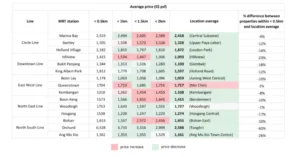
A 2017 study found buyers were willing to pay roughly 13% more for units within 400m of a station. More recent research from URA and SRX puts the typical premium in the 10% to 15% range, with newer analyses of projects within 400m of a launch station showing premiums stretching up to 20% in some cases. 

Developments with direct MRT integration, where residents can access the station from the building’s basement without stepping outdoors, tend to command the strongest and most defensible premiums of all, since that convenience simply can’t be replicated by any nearby but non-integrated project.

Stage 3: The Construction Dip

Here’s the part of the MRT Effect on Property Prices that catches a lot of buyers off guard, because it runs counter to what you’d assume. Once construction actually begins, prices near the future station often soften, sometimes noticeably.

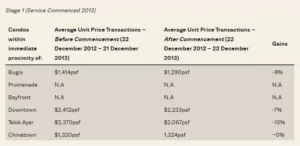
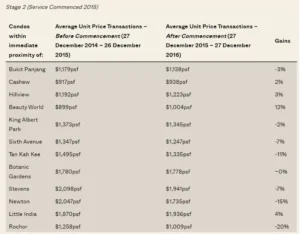
The reason is straightforward. Noise, dust, and traffic disruption from years of tunnelling and station works are a real, daily inconvenience, and buyers price that discomfort in. Data from developments near Bedok Reservoir MRT showed prices declining nearly 10% once construction infrastructure works began, reversing a chunk of the earlier announcement gains.

This dip is actually one of the more useful things to understand about the MRT effect, because it often creates a genuine buying window. Analysts have found that once a line is completed, nearby properties can enjoy a premium of 10% to 30% depending on proximity and market conditions, meaning the temporary construction-phase softness can be an opportunity rather than a warning sign, provided you’re prepared to hold through the disruption.

Stage 4: The Opening Effect, and Why It Doesn’t Play Out the Same Everywhere

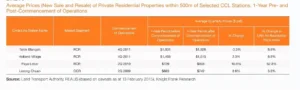
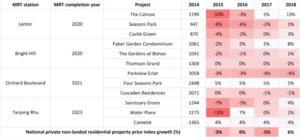
Once a station finally opens, prices generally rise again, reversing the construction dip and then some. Historical studies of past line openings show nearby property values appreciating roughly 3% to 8% in the 12 to 24 months surrounding a station’s opening.

But this is the stage where the MRT effect gets genuinely nuanced, and it’s worth slowing down here. The size of the opening-day bump depends heavily on three things:

  • How much the area relied on the MRT beforehand. Suburban estates that previously had poor access see the largest gains, since residents there depend on the new line far more for daily commuting. Well-connected central areas see comparatively little uplift, since residents there weren’t lacking transport options to begin with.
  • Whether the station is an interchange. Interchange stations, like Clementi (EWL to future CRL) or King Albert Park (DTL to future CRL), multiply the number of destinations reachable without transferring, and tend to command a larger, more durable premium than a standalone station on a single line.
  • Whether exclusivity was already priced in. Upscale central districts that were already well-connected before a new line arrived often see minimal additional gains, since the area’s prices already reflected strong accessibility long before the new station showed up.

Where the MRT Effect Is Playing Out Right Now

If you’re trying to apply the MRT effect to today’s market rather than a historical case study, here’s where the action currently sits.

  • Cross Island Line corridor – Ang Mo Kio, Bishan, Hougang, Serangoon North, and Pasir Ris in the east; King Albert Park, Clementi, and the Jurong Lake District in the west. Clementi and King Albert Park are particularly notable since both become interchanges, and the western stretch is delivering first-time MRT access to areas like Sunset Way and West Coast that have never had a station before, which is exactly where the announcement effect tends to hit hardest.
  • Jurong Region Line corridor – Tengah, Choa Chu Kang, Boon Lay, and the Jurong Innovation District. Properties here are still, at least partially, priced without the full transit premium factored in, since JRL Stage 1 only opens from 2027.
  • A word of caution – much of the CRL’s connectivity premium is already priced in years ahead of opening. Buyers entering the market for confirmed Phase 1 stations today may be paying for gains the market has already anticipated, rather than gains still waiting to happen. The MRT effect rewards early entry, not entry after everyone else has already noticed.

What the MRT Effect Doesn’t Tell You

It’s worth being honest about the limits here. Buying near an MRT station is not a guaranteed path to appreciation. The MRT effect is one input among many, not a standalone investment strategy. Tenure, unit layout, surrounding supply, school proximity, and broader market cycles all matter just as much, sometimes more, than distance to a station.

There’s also a longer-term consideration worth flagging. As more and more of Singapore ends up within walking distance of some MRT line, the scarcity that drives premium pricing today could gradually erode. A station within 400m might not command the same 15% to 20% premium in fifteen years that it does now, simply because far fewer properties will lack that access by then.

Getting the Timing Right

If there’s one takeaway from studying the MRT effect across multiple line openings, it’s that timing matters as much as location. Buying right after an announcement, before construction disruption sets in, tends to capture the earliest and often largest gains. Buying during the construction dip can work well for patient investors who can tolerate a few years of noise in exchange for a lower entry price. Buying only after a station opens usually means you’re paying for gains that have already materialised.

At SG Luxury Condo, this is exactly the kind of timing question our Property P.L.U.S System is built to help clients think through, weighing the MRT effect alongside tenure, unit mix, and where a project sits in its own price cycle. If you’re studying a specific corridor, our breakdown on which MRT lines add the most value to your property purchase goes deeper into line-by-line comparisons, and our guide on using the URA Master Plan to navigate property investment shows you how to spot these announcements before they become common knowledge.

A Word From SG Luxury Condo

The MRT effect is real, well documented, and worth paying attention to, but it’s not a substitute for proper due diligence. We’ve seen clients get excited about a station announcement and overpay for a project that was never going to perform as well as a slightly further, better-built alternative nearby. Understanding which stage of the MRT effect a station is currently in- announcement, construction, or post-opening- tells you far more about whether now is a good time to buy than distance alone ever will.

If you’d like a second opinion on how the MRT effect applies to a specific project or corridor you’re considering, SG Luxury Condo is happy to walk through the numbers with you. You’re also welcome to browse our full range of luxury condos for sale in Singapore if you’d rather explore projects already benefiting from strong MRT connectivity today. For a more structured look at how SG Luxury Condo weighs timing against these transit catalysts, our property consultation sessions are a good place to start.

Advanced Heading

Frequently Asked Questions

How much of a price premium does MRT proximity actually add?

Most studies put it between 10% and 15% for properties within 400m to 500m of a station, though some recent analyses of prime new launches show premiums stretching up to 20%. Beyond about 800m, the premium largely disappears.

Noise, dust, and traffic disruption from tunnelling and station works genuinely affect quality of life nearby, and buyers price that discomfort in. Historical data has shown declines of close to 10% during active construction phases, even in areas that saw strong gains right after the line was first announced.

Generally, buying right after an announcement, or during the construction dip if you can tolerate the disruption, captures more of the MRT effect than waiting until after the station opens, since a lot of the opening-day premium gets anticipated and priced in well beforehand.

No. Lines that connect underserved suburban areas to the CBD tend to have a bigger effect than lines running through already well-connected central districts. Interchange stations, which link multiple lines, also tend to command stronger premiums than standalone stations.

The Cross Island Line and Jurong Region Line are the two biggest catalysts currently in play. CRL Phase 1 opens in 2030, Phase 2 in 2032, while JRL opens in phases starting 2027, mainly benefiting the western corridor around Tengah, Choa Chu Kang, and Jurong.

For many confirmed Phase 1 stations, yes, at least partially. Markets tend to anticipate confirmed infrastructure years ahead of completion, so buyers entering now may be paying for connectivity gains the market has already factored in, rather than gains still to come.

The general pattern, announcement bump, construction dip, opening gain, holds for both, though the exact premium size differs. Private condos near new stations, especially those with direct MRT integration, tend to see the most pronounced and durable premiums.

Not necessarily forever. As the network expands toward the government’s target of 8 in 10 households within a 10-minute walk of a station by 2030, the scarcity that currently drives strong premiums could gradually shrink, since fewer properties will lack MRT access to begin with.

Interchange stations connect two or more lines, multiplying the destinations reachable without switching trains. This generally makes them more valuable and gives nearby properties a stronger, more durable premium than a standalone station serving only one line.

Not purely for that reason. The MRT effect is a real and measurable factor, but tenure, unit layout, builder quality, school proximity, and the surrounding supply pipeline all matter just as much. Treat MRT proximity as one strong input in your decision, not the whole decision itself.

Free 30 min Consultation Call
IT'S TIME TO DISCOVER
Your Dream Luxury Condo Home
CONTACT AGENT
Senior Realtor
JAMES LIM

Property Consultant & Analyst

Contact Us
FORM-ONE (footer and popup)

© 2026
SGLUXURYCONDO
ALL RIGHTS RESERVED.

USE OF THIS SITE CONSTITUTES ACCEPTANCE OF OUR TERMS OF USE AND PRIVACY POLICY